Skip to content

strategy | Strategies / Strategy Builder / Backtesting

Axiom Strategy Lab Pro

Axiom Strategy Lab Pro turns YAML-defined setups, entries, targets, and stops into executable TradingView backtests so you can test ideas faster without outsourcing the logic. It is built for serious traders who want honest process, repeatable experiments, and ownership over what they build, not rented conviction.

Last updated: Apr 4, 2026

Crypto / Futures / Stocks / Forex / Indices | ANY

Axiom Strategy Lab Pro lead

Best-fit markets

CryptoFuturesStocksForexIndices

Primary timeframes

ANY

Product details

Explore the details to see whether the tool fits the problem you are trying to solve for.

Axiom Strategy Lab Pro

Overview

A trader with a methodology still has to test it. The rules exist — in a notebook, on a whiteboard, somewhere in their head. Turning those rules into a rigorous backtest means learning Pine Script, hiring a developer, or counting trades by hand. Pine has a real learning curve. Developers cost money and become a dependency every time a rule changes. Manual backtesting is slow, inconsistent, and impossible to reproduce. Good ideas sit unproven and bad ones go unchallenged, because the path from "I think this works" to "here is what actually happened" is too expensive to walk.

Axiom Strategy Lab Pro is not a strategy. It is a strategy-building environment. The script ships with no hardcoded trading rules. You write your setups, entries, take profits, and stop losses in structured YAML configuration, paste them into the settings panel, and the builder compiles those definitions into executable logic inside TradingView's Strategy Tester. When you want to change a rule, you change the YAML and rerun the test. No code edits. No developer dependency. No waiting.

Why this matters

Every untested trading rule is a position taken on faith. When you cannot test whether your methodology holds up against historical data, you have no way to separate the rules that worked from the luck that held. Your wins might be skill. Your losses might have been preventable. Without a way to run the experiment, you never find out — and not knowing compounds.

This builder closes the gap between having rules and being able to test them. It handles the translation from your definitions to simulated trades inside the Strategy Tester. You decide what to test. You judge the results. You own the methodology. The builder handles the machinery — turning rules into orders — so the question moves from "can I even run this experiment?" to "what did the experiment show?"

Who this is for

Traders who have a methodology they want to test and are willing to learn a structured configuration language to do it. The YAML has a learning curve — that curve is the cost of owning every rule in your strategy instead of depending on someone else's code.

Who this is not for

Anyone looking for a ready-made strategy to drop on a chart. Anyone expecting a positive backtest to mean the strategy will work going forward. This tool lets you test your thinking rigorously. It does not replace the thinking.

The honesty boundary

The Strategy Tester runs on historical data under assumptions you configure — commission, slippage, fill model, historical depth. Every one of those assumptions simplifies something that behaves differently in a live market. The builder makes honest testing possible. It does not make the results predictive. A good-looking equity curve is the start of an investigation, not the conclusion of one.


Core logic

The builder operates on a three-layer hierarchy that evaluates every bar:

Setups define when trading is allowed. Each setup carries a gate condition that must be true before anything else evaluates, an activation expression that moves the setup toward confirmation, an optional confirmation period, cooldown rules, and a cap on how many entries can fill per activation. Setups work as structured windows — they open when your conditions align and stop admitting new entries when the setup cancels, resets, or exhausts its activation-scoped entry cap.

Entries belong to setups. An entry only evaluates when its owning setup is confirmed. Each entry has its own gate condition, trigger expression, order type, allocation size, and optional price expressions for limit and stop orders. Entries can fire once per setup activation or add to an open position up to a maximum you set.

Exits attach to entries and manage how positions close. Take-profit and stop-loss intents each carry their own gate conditions, trigger expressions, order types, and allocation percentages. Exit quantities are calculated proportionally against the peak position size for each entry group — not against whatever is left after earlier exits fill — so your exit ladder holds its shape from the first fill to the last.

A built-in GLOBAL setup exists for each enabled direction. Any entry or exit that does not specify a parent setup attaches to GLOBAL, which is always confirmed. You can build a complete strategy using only GLOBAL, or you can define named setups that gate entries to specific market conditions.


Entry rules

When the builder evaluates entries on each bar, it follows this sequence:

  1. Setup check — Is the owning setup confirmed? If not, the entry does not evaluate.
  2. Gate check — Is the entry's own gate condition true? This is a second filter on top of setup confirmation.
  3. Trigger check — Has the entry's trigger expression fired?
  4. Confirmation — If a confirmation count is configured, the trigger must stay true for the required number of bars or ticks before the entry becomes ready.
  5. Cap and mode check — Has the setup-level entry cap been reached? Is this a one-shot entry that already fired for this activation?
  6. Order construction — The builder computes the allocation-based position size, resolves any limit or stop price expressions, and submits the order.

Entries and exits support market, limit, stop, and stop-limit order types. Non-market entry orders stay working across bars until they fill, get cancelled by a cancel-when condition, expire if that entry defines entry_expire_after_bars, or get cleaned up when their parent setup resets. Non-market exits stay working until they fill, are cancelled, or lose their position cycle.

Price latching: When enabled, the limit or stop price locks at the moment the entry condition first triggers. The order holds that price on subsequent bars rather than recalculating, which prevents drift while the order is working.

One-shot vs. pyramiding: One-shot entries fire once per activation scope and stay latched until that scope resets. For named setups, that means once per setup activation. For GLOBAL entries, that means once per position cycle. Pyramiding entries can add to an open position up to the maximum you configure. The pyramiding maximum you set in YAML interacts with the strategy-level pyramiding cap in the Properties tab — whichever is lower takes effect.


Exit rules

Exits evaluate per entry group — each unique entry that has produced open trades. For each group, the builder processes all applicable take-profit and stop-loss intents:

  1. Gate and trigger check — Each exit has its own conditions that must be met before it can fire.
  2. Quantity calculation — The allocation percentage you define is calculated against the anchored baseline: the peak position size that entry group reached. If you set TP1 at 30% and TP2 at 70%, TP2 closes 70% of the original position, not 70% of whatever TP1 left behind. This keeps your exit ladder proportional across the full sequence.
  3. Scaling and clamping — Quantities adjust to the currently open position to prevent over-closing. Any rounding residual is assigned to the largest allocation leg so there are no leftover dust positions.
  4. Order submission — Market exits close immediately. Limit, stop, and stop-limit exits are placed as working orders, sorted nearest-to-price first. Orders use reduce-only grouping so they shrink the position rather than opening a new one in the opposite direction.

Price latching on exits works the same way as on entries — when enabled, the exit order's price locks at the moment the condition triggers and does not recalculate on subsequent bars.


Risk model

Direction mode and four strategy-level circuit breakers operate above your YAML-defined logic:

ControlDefaultWhat it does
Strategy DirectionLong OnlyRestricts which direction the builder evaluates. Choose Long Only, Short Only, or Swing Mode.
Max strategy drawdown20% of equityHalts all trading when drawdown from peak equity exceeds this threshold.
Max consecutive loss days5Halts trading after this many consecutive losing days.
Max intraday loss10% of equityHalts trading when single-day loss exceeds this threshold.
Max intraday filled orders10Caps the number of order fills in a single day.

These controls operate within the Strategy Tester simulation. They are not live-execution safeguards. They limit what the simulation models, which is useful for building strategies that respect real-world risk boundaries, but they do not protect actual capital.

Order expiration is not a global risk control in this build. Non-MARKET entry expiration is configured per entry with entry_expire_after_bars.

A consent checkbox requires you to confirm you have reviewed the Properties tab before the strategy will run. The Properties tab settings directly shape your backtest results — testing under defaults you never reviewed means testing under assumptions you never chose.


Backtest assumptions

Every number the Strategy Tester produces is a product of assumptions. Change any one of these and the results change with it. Understand what each setting controls before you read anything the tester shows you.

Slippage — 15 ticks: Models how far the fill price deviates from the order price. Fifteen ticks is reasonable for liquid instruments and may understate the problem on illiquid ones. If you test on thin markets, increase it. Setting it to zero simulates a market that does not exist.

Commission — 0.1%: Models per-trade cost. The default suits crypto spot trading at standard fee tiers. For equities, futures, or forex, the real cost structure is likely different. Match this to the venue and fee schedule you actually trade on.

Fill on standard OHLC: The tester decides whether your limit or stop order filled by checking the bar's open, high, low, and close — not intrabar tick data. For strategies with tight price levels, fills can appear in the test that would not occur in real time, or the reverse.

Process orders on open: Orders submitted during a bar execute at the next bar's open. There is a built-in timing gap between when your condition triggers and when the fill occurs. Strategies that depend on immediate execution will behave differently in the tester than they would live.

Bar magnifier off: The tester does not refine fills using intrabar price paths. It assumes price can reach any point within the bar's range in any sequence. This matters most for strategies with multiple orders that could interact within a single bar.

Pyramiding at 50: Up to 50 concurrent open trades are allowed by default. If your rules do not intentionally stack positions that deep, reduce this number or cap entries in your YAML. High pyramiding with no deliberate controls produces results that look dramatic and mean nothing.

Calc bars count — 50,000: The backtest runs on up to 50,000 historical bars. On a 1-minute chart, that may cover a few weeks. On a daily chart, it could span decades. Know how much history your test covers and whether the sample supports whatever conclusions you are drawing from it.


How to run in Strategy Tester

  1. Add the script to your chart.
  2. Open the settings panel. Paste your YAML definitions into the appropriate text areas — long setups, long entries, long take profits, long stop losses, and the corresponding short sections if you are running Swing or Short Only mode.
  3. If your expressions reference external indicators, add those indicators to your chart first. Then link their outputs to custom token slots in the settings and give each token a name that your YAML will reference.
  4. Open the Properties tab. Adjust commission, slippage, initial capital, pyramiding, and other settings to reflect the trading environment you intend to test against.
  5. Check the consent checkbox to confirm you have reviewed the Properties tab.
  6. Open TradingView's Strategy Tester panel to view results.

First-run verification: Enable "Show schema summary table" in the settings to confirm the builder parsed your YAML correctly. If something is wrong, enable the runtime error table — it reports parsing failures, expression errors, and configuration problems directly on the chart.

Ongoing verification: Enable "Show expression value label" to watch how each condition in your YAML evaluates bar by bar. This is the most direct way to confirm your rules behave as intended and to trace the cause of any trade you did not expect.


For the geeks

The builder is not a conventional strategy script with fixed conditions baked into the code. It is a runtime engine that reads, compiles, and evaluates trader-authored rules each time the script loads.

Here is what happens between the YAML you write and the trades that appear in the tester:

Parsing — A dedicated parsing library reads your YAML text, validates the structure, checks required fields, normalizes defaults, and produces a typed schema representing every setup, entry, take profit, and stop loss you defined.

Expression compilation — The engine compiles every expression in your YAML — gate conditions, trigger logic, price formulas — into an evaluable form before bar-by-bar processing begins. Expressions reference named tokens: price fields, bar state, strategy statistics, position information, and any custom indicator outputs you linked. These tokens resolve against a map that refreshes on every bar, so your conditions always reflect the current state.

Setup evaluation — Named setups move through inactive, confirming, and confirmed runtime states. The _ACTIVE token is a convenience boolean, not a distinct state. Conditions you define govern each transition. This means entries do not evaluate on every bar regardless of context — they evaluate only when their parent setup has reached the confirmed stage, creating structured windows of eligibility rather than a constant free-for-all.

Order reconciliation — Once the engine determines which entries and exits should fire, it translates those intents into native TradingView strategy calls and the Strategy Tester simulates the result.

What you can verify: The schema summary table shows exactly what the parser extracted from your YAML. The expression debug label shows how each expression evaluates in real time on every bar. The runtime error table catches anything that failed to parse, resolve, or validate. Between these three diagnostics, you can trace the full path from YAML to trades without guessing.

What this section does not cover: The parser's internal field resolution, the expression compiler's operator implementation, the state machine's transition constants, and the order reconciliation internals. Those details make the engine work. They are not needed to use it, verify it, or build confidence in what it produces.


FAQ

I pasted my YAML but the strategy shows no trades. What is wrong?

Start with the basics. Is the consent checkbox checked? Without it, the strategy will not run at all. Next, enable the schema summary table and the runtime error table. If your YAML has a syntax problem — a missing colon, a broken indent, a field name the parser does not recognize — the error table will flag it. If the schema parses cleanly but no setups are activating, enable the expression debug label and check whether your gate and activation conditions are actually met on the instrument and timeframe in front of you. Sometimes the conditions are valid but never align on that particular data — that is a finding about your rules, not a problem with the builder.

My backtest shows strong results. Can I trade this live?

A strong backtest means your rules produced favorable simulated outcomes under the specific assumptions you configured, on the specific historical data the tester covered. It does not mean those rules will produce the same outcomes going forward. Before treating any backtest as actionable: verify the slippage, commission, and fill assumptions you ran with. Test on different date ranges or instruments. Ask yourself honestly whether you kept adjusting rules until the equity curve looked right — that is curve-fitting, and it is the most common way a tool like this creates false confidence. A positive backtest is a hypothesis that warrants further testing, not a conclusion.

How do I connect an indicator on my chart to use in my YAML expressions?

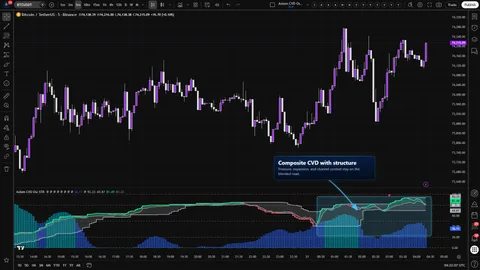
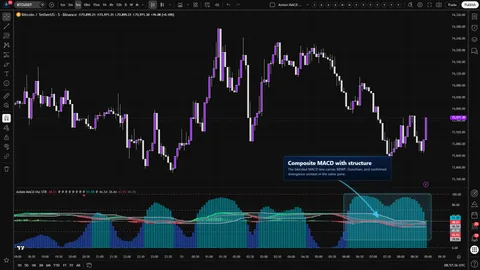
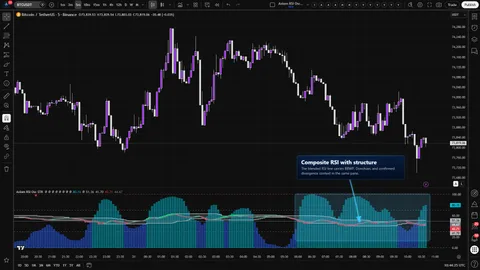
Add the indicator to your chart first. In the builder's settings, find the custom token section — there are 30 slots available. For each slot, select the indicator's output as the source and assign a name (for example, RSI_VALUE or VOL_MA). That name becomes available in your YAML expressions wherever you need it. One thing to know: the builder cannot check whether a linked indicator repaints. If it does, your backtest will use information that was not actually available at the time each bar closed, and the results will be unreliable. Verify repainting behavior yourself before trusting any test that depends on external indicator tokens. If in doubt check out our own Axiom Indicator library for the tool you might need - our indicators are all Strategy Lab approved by default.

Why did the strategy take a trade I did not expect?

Enable the expression debug label and find the bar where the trade occurred. Check what your setup gate, setup activation, entry gate, and entry trigger evaluated to on that specific bar. Common causes: a gate condition that is broader than you realized, a trigger expression that fired on an intrabar evaluation you were not watching, or an entry attached to GLOBAL (which is always confirmed) rather than to a named setup. Also check the Properties tab — if the pyramiding cap is higher than you intended, entries can stack in ways that look unplanned but match exactly what the configuration allows.

What happens if I set slippage and commission to zero?

The backtest will look better than any real trading environment could produce. Slippage and commission model the costs that reduce every real trade's return. Removing them removes the simulation's connection to actual execution conditions. If you want to isolate whether your entry and exit logic has structural merit, keep costs at conservative levels and compare gross versus net equity. If the strategy only looks viable at zero cost, it does not work.


Claims and interpretation guardrails

The Strategy Tester produces numbers. Numbers feel objective. But every figure on the results tab is the output of a simulation running under the assumptions you configured — or left at default. Here is how to read the results without letting them become something they are not.

Net profit is the simulated outcome after the slippage and commission you set. Change either setting and the figure changes with it. It describes a historical simulation, not a forward projection.

Win rate reflects the pattern the simulation found under your specific conditions. It does not describe the future. A high win rate paired with a low average win and a large average loss is a losing approach disguised as a winning one — the math catches up when the loss arrives.

Max drawdown is the deepest peak-to-trough decline the simulation recorded. It is the worst that happened in the test, not the worst that can happen in live markets, where liquidity gaps, exchange failures, and correlated moves create drawdowns no historical simulation can anticipate.

Equity curve shape is the most seductive and least informative output in the tester. A smooth upward curve feels like validation. Ask: would this shape survive a different data window? Different cost assumptions? A market regime that did not exist in the test period? If you adjusted rules until the curve looked good, you were not testing a strategy — you were fitting a line to noise.

Trade count determines how much weight any statistic deserves. A strategy that produced 15 trades and a 70% win rate has not proven anything. Small samples support weak conclusions regardless of how good the numbers look.


Limitations

The Strategy Tester is not a market. It does not model order book depth, partial fills, requotes, exchange downtime, or liquidity constraints. Strategies that work in simulation can fail live for reasons the simulation has no way to represent.

Fill timing differs from live execution. MARKET entries process on the next bar's open, MARKET exits in this build use same-bar immediate closes, and working exits fill against the bar's OHLC range rather than true tick-by-tick sequencing. Strategies with tight price targets or time-sensitive entries will behave differently in practice than in the tester.

Rapid iteration enables overfitting. The builder makes it fast to change rules and rerun tests — that is one of its core strengths. It becomes a weakness when speed turns into a loop of adjusting rules until the equity curve looks good on the visible data without confirming the rules capture something real. Out-of-sample testing and walk-forward analysis are outside the builder's scope and inside yours.

External indicators can contaminate results. When you link an indicator as a custom token, the strategy's behavior depends on that indicator's calculation. If the indicator repaints — revising past values with information that was not available when those bars closed — the backtest incorporates future data and the results are invalid. The builder cannot detect this. You need to verify it. If in doubt again use Axioms indicator library because they're all written with this already in mind.

Complexity is not a feature. Thirty custom tokens, unlimited setups per direction, multiple entry and exit tiers, four order types, price latching, pyramiding, OCA grouping — the builder gives you room to build something very elaborate. Elaborate strategies are harder to interpret, harder to debug, and more prone to overfitting. A simple set of rules that survives scrutiny across different conditions is worth more than a multi-layered configuration that only works on the data it was shaped against.

This builder does not automate live trading. The script includes no alert or webhook functionality. TradingView offers strategy-level alerts as a platform feature, triggered on simulated order fills, but connecting those alerts to a live broker requires external tooling and introduces execution risks that fall outside what the Strategy Tester models.


Support and training

For documentation, configuration reference, and support, visit the Axiom Charts website.

When you hit a configuration issue, start with the builder's own diagnostics before reaching out. The schema summary table shows whether your YAML parsed correctly. The expression debug label shows how your conditions evaluate in real time. The runtime error table catches parsing failures, expression problems, and configuration mistakes. These three tools answer most troubleshooting questions faster than any external channel.


Disclaimer

This script is provided for educational and informational purposes only. It is not financial advice. Nothing in this description or in the strategy's output should be interpreted as a recommendation to buy, sell, or hold any financial instrument.

The Strategy Tester simulates trades on historical data under assumptions the user configures. Simulated results do not represent actual trading, do not account for all real-market conditions, and do not predict future performance. Past simulated performance is not indicative of future results.

Trading involves substantial risk of loss and is not suitable for every person. You are solely responsible for your own trading decisions and for understanding the assumptions, limitations, and costs of any tool you use to inform those decisions.

Purchase options

$50.00/ month

14-day free trial

Open in TradingView

Related products

If this one is close but not quite right, there may be a better fit nearby for the same kind of chart work, testing need, or workflow gap.

Back to products

Keep looking

If this one is close but not quite right, there may be a better fit nearby for the same kind of chart work, testing need, or workflow gap.

Find your starting point

Weighing a few options against each other?

Tell us what you are trying to accomplish and we will help you narrow it down honestly.