indicator | Oscillators / Volume / CVD
Axiom CVD Osc Lite
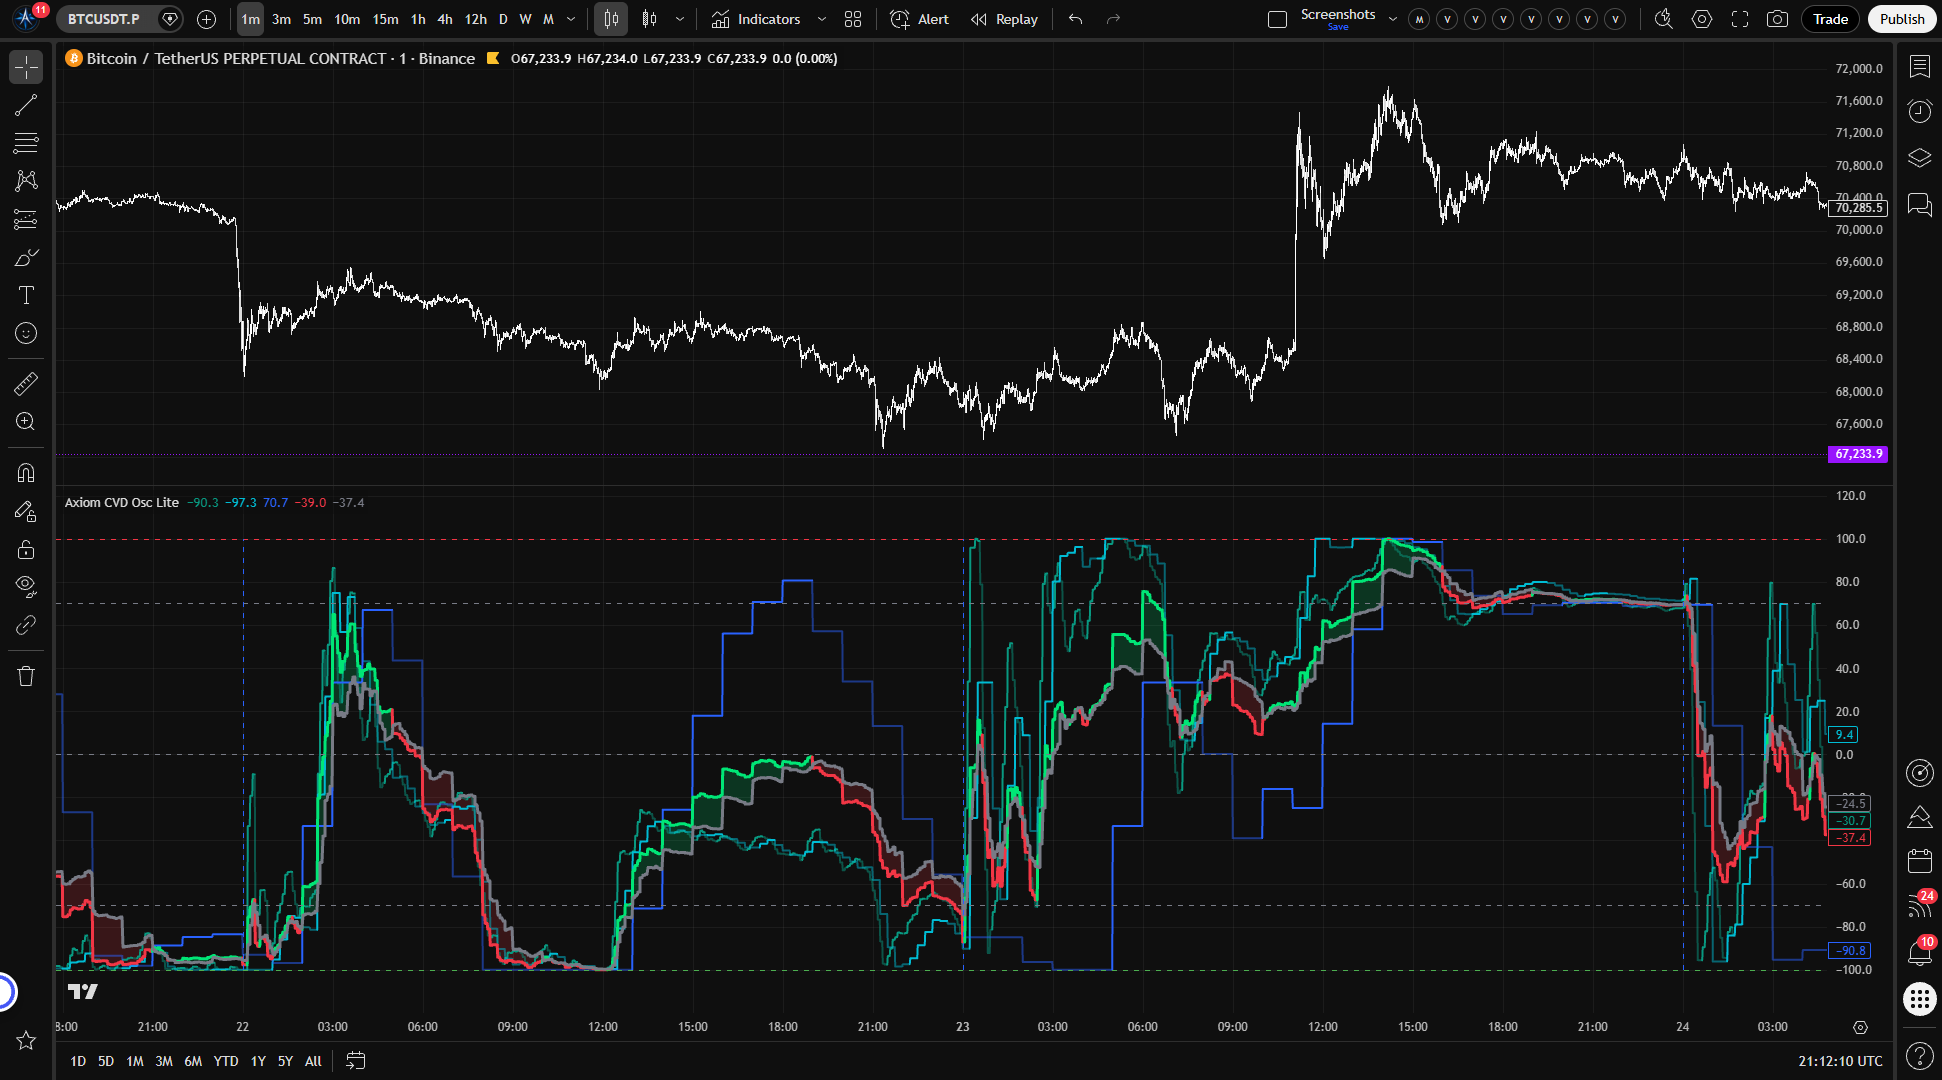
Axiom CVD Osc Lite estimates directional volume pressure across up to three higher-timeframe slots, normalizes each one to a bounded scale, and blends them into one readable pane. It is for traders who want faster multi-timeframe pressure context and clear repaint disclosure, not fake order-flow certainty.
Last updated: Apr 4, 2026
Crypto / Futures / Stocks / Forex | 1m / 5m / 15m / 1H / 4H
Best-fit markets
Primary timeframes
Product details
Explore the details to see whether the tool fits the problem you are trying to solve for.
Axiom CVD Osc Lite
Overview
If you watch volume delta across more than one timeframe, you already know the three problems that come with it. The estimate never tells you how it was built. The multi-timeframe lookup might be repainting without announcing it. And the cumulative values drift so far from zero by mid-session that the chart loses any visual meaning it once had.
This indicator exists to make those three problems answerable. It runs up to three independent CVD slots — each pulling lower-timeframe candle data to estimate directional volume participation — normalizes every slot to a bounded -100 to +100 range, and blends the results into a weighted composite with a signal line. You get multi-timeframe pressure context in a single pane, scaled so the readings stay comparable and readable across the full session.
Before features, the estimation boundary: this is not order-flow data. The delta is estimated from OHLCV candle structure. Each intrabar gets scored on body direction, close position within its range, and wick rejection, then classified into graduated participation buckets. That recovers more directional information than a simple close-vs-open approach, but it is still an inference from price and volume — not a measurement from the bid/ask tape. The word "CVD" carries order-flow expectations. This tool earns its place differently.
Repainting is a switch you control. With On Bar Close enabled (the default), every slot uses the last confirmed higher-timeframe value. Historical output does not change after the bar closes. With On Bar Close disabled, the output tracks the building HTF bar in real time — and values will shift until that bar completes. Both modes are labeled. Toggle them on a live chart and the difference is visible within a few bars.
Good fit: A trader who already works with volume context across multiple timeframes and is willing to learn what the settings control before relying on the output.
Not the right fit: Someone expecting literal order-flow data from a candle-based estimate. Someone who wants a buy/sell cue rather than a pressure reading. Someone uninterested in learning what the settings control before adjusting them.
Why this matters
Directional volume pressure that agrees across timeframes is genuinely useful context for a discretionary trader — the kind of context that saves real time when the alternative is flipping between separate CVD charts and mentally reconciling unbounded values. But that usefulness falls apart the moment the reading is unstable, the estimation is vague, or the output drifts past the point where you can compare one timeframe to another. A CVD tool that hides any of those dimensions does not actually save you time. It moves the uncertainty somewhere you cannot see it. This indicator makes those three dimensions — estimation approach, windowing logic, repainting behavior — things you can examine and configure. The value is not just the number. It is knowing what that number measures and being able to verify how it got there.
Features
Slot CVD lines (up to 3) — Each enabled slot draws its own normalized CVD line, colored by regime: one tint when CVD sits above its signal line, another when it falls below. You see each timeframe's pressure reading individually, side by side, in one pane.
Blended CVD line — A weight-normalized composite across every enabled slot. One line for the full timeframe stack when you need a single read instead of three. Blend weights auto-normalize, so disabling a slot does not break the composite — the remaining slots absorb its share.
Blended Signal line — A smoothed derivative of the blended CVD that defines the regime boundary. CVD above Signal reads bullish; below reads bearish. The distance between them shows how far momentum is leading or trailing its smoothed baseline.
CVD/Signal fill — Shaded area between the blended CVD and Signal that shifts color with regime direction. Expanding green fill means bullish pressure is widening its lead. Expanding red means bearish pressure leads. Narrowing fill means the current regime is losing ground.
Session reset markers — Vertical dashed lines at window boundaries for any slot running in Session mode. They mark exactly where the accumulation restarted, so you are never guessing about the anchor point.
Reference lines — Horizontal markers at -100, the oversold level, zero, the overbought level, and +100. A fixed grid for the bounded range. The overbought and oversold thresholds are configurable.
How to use
- Add the indicator to your chart. A 5-minute chart works well for initial verification.
- Defaults enable three CVD slots at 5m, 15m, and 60m with lower-TF precision at 1m, 1m, and 5m. Window mode is Session anchored to Daily. Smoothing is SMA(3) for both CVD and Signal. Blend weights are equal across all three.
- Confirm the output stays within -100 to +100.
- Toggle "On Bar Close?" off and watch values update live as the current bar builds. Toggle it back on and confirm values freeze at the last completed HTF bar.
- Verify that dashed session-reset lines appear at daily boundaries for the session-mode slots.
What correct first use looks like: Three colored oscillator lines moving within the bounded range. A blended CVD line crossing above and below a Signal line. Translucent fill that shifts color with regime changes. Vertical markers at each session boundary. No runaway drift. Resets exactly where expected.
Settings
Per-slot settings
Each of the three CVD slots (CVD 01, CVD 02, CVD 03) shares the same control surface.
Enable (default: on for all three) — Whether the slot runs, plots, blends, and fires alerts. Disable any slot you are not actively using — leaving unused slots enabled adds visual clutter and consumes request budget for nothing.
Hide Plot (default: off) — Hides the slot's line from the chart but keeps the slot active in the blend and in alert calculations. Useful when you want a slot's weight in the composite without the visual. A hidden slot still influences the blended output.
Timeframe (defaults: 5 / 15 / 60) — The higher timeframe whose data the slot processes. Must be at or above the chart timeframe — the script enforces this at runtime and produces an error if you violate it.
Lower TF Precision (defaults: 1 / 1 / 5) — The smaller timeframe supplying the intrabar OHLCV arrays for delta estimation. Lower values give finer-grained scoring but depend on data availability for that instrument and timeframe pair. Must be strictly below the slot's timeframe.
Window Mode (default: Session) — Session anchors CVD accumulation to a periodic reset boundary. Rolling uses a continuously sliding lookback with no resets. Rolling tends to serve 24/7 markets better, where a daily anchor boundary can feel arbitrary. Session suits instruments with meaningful opens and closes.
Window (default: D) — In Session mode, the reset anchor period. In Rolling mode, the sliding lookback duration. Must be at or above the slot timeframe in either mode.
CVD Length (default: 3) — Smoothing applied to the normalized CVD value. Higher values calm the line. Lower values keep it responsive. Length 1 passes raw normalized CVD — intentional when you want the unfiltered reading, noisy when you do not.
CVD Type (default: SMA) — The moving average algorithm for CVD smoothing, from the Axiom Lite MA Library. Includes SMA, EMA, ALMA, and others. Selecting ALMA activates the global ALMA parameters.
Signal Length (default: 3) — Smoothing for the Signal line derived from CVD. Longer values slow regime transitions. Shorter values make flips faster and more frequent in choppy conditions.
Signal Type (default: SMA) — Moving average algorithm for Signal smoothing.
Blend Weight (default: 33.3) — The slot's relative contribution to the blended composite. Weights auto-normalize across enabled slots. A weight of 0 removes the slot from the blend while keeping its plot and alerts active — that is intentional, not broken.
Pressure Sensitivity (default: 1.50 · range: 0.25–4.0) — Controls how aggressively the participation model classifies each intrabar into strength buckets. Higher values commit bars to strong classifications faster and make neutral bars carry more of the prior classified direction — useful on trending instruments, risky in chop. Lower values preserve more graduated nuance — useful in choppy conditions. At the maximum, the model becomes much more decisive and the graduated bucket behavior flattens out.
Wick Weight (default: 0.20 · range: 0.0–0.50) — Controls how much wick rejection influences the participation score. Increase it on instruments where rejection candles carry real information about absorption or exhaustion. Decrease it where wick noise is common. At the maximum, wick imbalance can override what the body and close position are telling you.
Optional Ticker (default: chart symbol) — Overrides the data source for this slot. Useful for cross-market reads — watching BTC pressure while charting an altcoin, for instance. Choosing a low-volume or delisted ticker will degrade the estimate.
Global settings
Overbought / Oversold Levels (defaults: 70 / -70) — Reference lines and alert thresholds for the upper and lower zones. Tighten for stricter extreme reads. Loosen for a wider working range. Setting both to ±100 duplicates the boundary lines and makes these thresholds meaningless.
Plot Blended (default: on) — Whether the composite CVD line, Signal line, and regime fill are drawn. Disable when you only want the individual slot reads.
Blended Line Width (default: 3) — Visual thickness of the blended lines. Preference only.
Enable Master Smoothing (default: off) — Applies a final MA pass to the blended CVD and Signal after weighting. Useful when the composite output is noisier than you need. Heavy master smoothing on top of already-smoothed slots compounds lag — use it deliberately or not at all.
Master MA Type (default: EMA) — Algorithm for master smoothing.
Master Length (default: 3) — Lookback for master smoothing.
On Bar Close? (default: on) — The repaint switch. When enabled, each slot uses the last confirmed higher-timeframe value and historical output is stable. When disabled, the output tracks the current building HTF bar and updates in real time — values will change until that bar closes. That is repainting by design, not a defect. Toggle it on a live chart to verify both behaviors yourself.
ALMA Offset (default: 0.85) — Global ALMA offset, shared across all ALMA-type selections. Only relevant when at least one MA type is set to ALMA.
ALMA Sigma (default: 6.0) — Global ALMA sigma. Same condition.
ALMA Floor Offset? (default: off) — Floors the ALMA offset to an integer value. Same condition.
Alerts
All 15 alert conditions fire only on confirmed bars. Nothing triggers mid-bar.
Per-slot alerts
| Alert | Fires when |
|---|---|
| CVD 01 Is Bullish | Slot 01 enabled, CVD > Signal, bar confirmed |
| CVD 01 Is Bearish | Slot 01 enabled, CVD < Signal, bar confirmed |
| CVD 02 Is Bullish | Slot 02 enabled, CVD > Signal, bar confirmed |
| CVD 02 Is Bearish | Slot 02 enabled, CVD < Signal, bar confirmed |
| CVD 03 Is Bullish | Slot 03 enabled, CVD > Signal, bar confirmed |
| CVD 03 Is Bearish | Slot 03 enabled, CVD < Signal, bar confirmed |
Blended alerts
| Alert | Fires when |
|---|---|
| Blended CVD Is Bullish | Blended CVD > blended Signal, bar confirmed |
| Blended CVD Is Bearish | Blended CVD < blended Signal, bar confirmed |
| Blended CVD Regime Flip | Bullish/bearish state changed on this bar |
| Blended CVD Crossed Above Zero | Blended CVD crossed above 0 |
| Blended CVD Crossed Below Zero | Blended CVD crossed below 0 |
| Blended CVD Overbought | Blended CVD crossed above the overbought level |
| Blended CVD Oversold | Blended CVD crossed below the oversold level |
Alignment alerts
| Alert | Fires when |
|---|---|
| All CVD Slots Bullish | Every enabled slot has CVD > Signal simultaneously |
| All CVD Slots Bearish | Every enabled slot has CVD < Signal simultaneously |
Behavior note: The regime alerts (bullish/bearish) fire on every confirmed bar where the condition holds, not only on transitions. Regime Flip fires only on the bar where the state actually changes. For most workflows, set the TradingView alert frequency to "Once Per Bar Close."
For the geeks
Most CVD tools estimate delta with a single rule: if the close sits above the open, the bar's volume is buying pressure. Below the open, selling pressure. It works. But it treats every bullish close as the same strength of conviction and throws away what the wicks and the close position are actually showing about how the bar traded.
This indicator scores each intrabar candle on three things: which direction the body moved, where the close landed within the full range, and whether the wicks suggest rejection in one direction. That composite score gets sorted into one of five participation levels — strong bullish, weak bullish, neutral carry, weak bearish, strong bearish. The bar's volume is then scaled by the participation level to produce signed delta.
In practice, that means a bar closing slightly higher but carrying heavy upper-wick rejection does not get counted the same as a bar closing near its high with clean follow-through. The model separates those cases because they represent different degrees of conviction. The output is graduated, not binary.
Two settings shape the classification.
Pressure Sensitivity moves the boundaries between participation buckets and adjusts how strongly neutral bars inherit direction from the prior state. Low values keep the model cautious — many bars stay in the weak or neutral range and the oscillator moves gently. High values make the model more decisive, which sharpens reads on trending instruments. At the extreme, the graduated system collapses and nearly everything gets classified as strong.
Wick Weight controls how much wick rejection matters in the scoring. At low values, body direction and close position do most of the work. At higher values, a pronounced rejection wick can shift the classification meaningfully — which is useful on instruments where wicks carry real information about failed attempts or absorption.
The normalization that keeps the output bounded works within each slot's active window — session or rolling. Positive CVD is scaled against the window's positive extreme and negative CVD against its negative extreme. Zero is always included in the normalization range. The result stays between -100 and +100 regardless of how far raw cumulative delta drifts underneath. Early in a session, the range is still narrow and the oscillator can swing to extremes quickly. As the window fills with more data and the range widens, the readings moderate.
You can verify all of this yourself. Set Pressure Sensitivity low and observe how many bars land in the weak or neutral range — the oscillator will move gently. Push it higher and watch bars commit to strong classifications faster. Adjust Wick Weight and see how candles with pronounced rejection wicks shift the output. Compare Session and Rolling modes on the same slot to see how the window choice reshapes the normalization envelope. The behavior is on the chart. Just look.
FAQ
Is this actual order-flow data?
No. This indicator estimates directional volume participation from OHLCV candle structure — not from bid/ask tape, footprint data, or depth-of-book feeds. The wick-aware model recovers more directional information from each candle than a close-vs-open test (see the For the geeks section), but the output is an inference from price and volume. If your process depends on that distinction, this is not a substitute for tape-level tools.
Does this indicator repaint?
That depends on a setting you control. With On Bar Close enabled (the default), each slot uses the last confirmed higher-timeframe value. Historical output will not change after the bar closes. With On Bar Close disabled, the output updates live as the current HTF bar builds, and values shift until that bar completes. That mode repaints by design. Toggle the switch on a live chart and you can see both behaviors within a minute.
What happens if intrabar data is not available for my instrument?
When the lower-timeframe request returns empty data — sparse history, an unsupported timeframe pair, or limited exchange coverage — the indicator falls back to estimating delta from the slot bar's own OHLCV at single-bar resolution. The result is coarser but still bounded, and it still runs through the same participation model. Test on your specific instrument and timeframe combination to check whether fallback is occurring and whether the output is granular enough for your needs.
Can I use all-slots-aligned as a trade entry?
Alignment means the pressure reading is bullish or bearish across every enabled timeframe at the same time. That is useful context — it confirms the stack agrees. It is not an entry signal. The alignment alerts exist to surface the condition, not to tell you what to do with it.
How do Pressure Sensitivity and Wick Weight affect the readings?
Pressure Sensitivity controls how decisively each intrabar gets classified into participation buckets. Low values keep the model cautious — gentle oscillator movement, more bars in the middle range. High values push toward committed classifications, sharper reads on trending instruments, but the graduated system collapses at the extreme. Wick Weight controls how much wick rejection contributes to the classification. Low values let body direction and close position dominate. Higher values give wick rejection a stronger vote. Both parameters are worth exploring across their range before settling — the For the geeks section covers the mechanics behind them.
Limitations
OHLCV estimation, not order flow. The delta values are an inference from candle structure. On instruments with thin volume or sparse lower-timeframe history, that inference becomes coarser. The oscillator still produces a number in those conditions — it does not flag that the estimate has degraded. Verify data quality on your specific instrument before relying on the readings.
Intrabar fallback. When lower-timeframe arrays come back empty, the indicator estimates delta from the slot bar's own OHLCV instead. The output is still bounded and still uses the participation model, but at single-bar resolution it loses the granularity that intrabar scoring was built to provide.
Window-dependent normalization. A reading of +70 in one session is not directly comparable to +70 in another. Each value represents the proportion of pressure relative to that window's extremes, not a fixed volume quantity. Comparing readings across different windows or across slots with different window configurations requires understanding that the denominator shifts with the data.
Session anchors on 24/7 markets. In Session mode, the accumulation window resets at the selected anchor boundary. On instruments that trade around the clock without a meaningful open, a Daily anchor can still feel arbitrary. Rolling mode exists for exactly this situation.
Not a signal generator. This indicator reads directional pressure across timeframes. It does not produce entries, exits, stop levels, or position sizes. Using alignment alerts or overbought/oversold crosses as standalone trade triggers is not what this tool does.
Support and training
Visit the AxiomCharts website for documentation, training materials, and support.
Disclaimer
This indicator is provided for educational and informational purposes only. It does not constitute financial advice, and no trading outcomes are implied or guaranteed. Past behavior observed in any backtest, demo, or historical view does not predict future results. Trading involves substantial risk of loss and is not suitable for every investor. You are solely responsible for your own trading decisions.
Free access
Read everything on this page first. Open it on TradingView only when you are clear on what it does and what it does not do.
Open in TradingViewRelated products
If this one is close but not quite right, there may be a better fit nearby for the same kind of chart work, testing need, or workflow gap.
Keep looking
If this one is close but not quite right, there may be a better fit nearby for the same kind of chart work, testing need, or workflow gap.
Find your starting pointWeighing a few options against each other?
Tell us what you are trying to accomplish and we will help you narrow it down honestly.