indicator | Trend Analysis / Donchian Channels / Multi-Timeframe
Axiom DC Lite
Axiom DC Lite stacks up to three Donchian Channel slots on one chart, adds weighted blending, and makes the confirmed-vs-live higher-timeframe tradeoff explicit. It is built for traders who read range boundaries as context and care whether the chart history they are studying is actually trustworthy.
Last updated: Apr 4, 2026
Crypto / Futures / Stocks / Forex / Indices | 1m / 5m / 15m / 1H / 4H / 1D
Best-fit markets
Primary timeframes
Product details
Explore the details to see whether the tool fits the problem you are trying to solve for.
Axiom DC Lite
Overview
Every trader who works with Donchian Channels across more than one timeframe runs into the same problem. Three instances of the same indicator, three separate configurations, three views to reconcile — and a question that most MTF overlays don't help you answer: when I scroll back through this chart, am I seeing what was actually there, or something the data filled in later?
Axiom DC Lite stacks up to three Donchian Channel configurations on a single chart. Each slot runs on its own timeframe with its own lookback, its own basis smoothing, and an optional alternate ticker. A fourth blended channel combines the active slots into a weighted composite. One global toggle controls whether the HTF data is confirmed or live — and that choice determines whether your chart history holds still or shifts when you're not watching.
Good fit: You already work with Donchian Channels or range-boundary tools and you want that multi-timeframe view consolidated. You care whether the historical data on your chart is stable enough to review.
Not a fit: You're looking for something that tells you when to enter or exit. This indicator marks where the range boundaries are. It has no opinion about what those boundaries mean for your next trade.
The repaint question, answered upfront: Default settings use confirmed HTF bar values — what was finalized, not what was forming. Historical chart data stays stable. Turning "On Bar Close?" off gives you faster updates at the cost of that stability: recent plotted values can change retroactively until the higher-timeframe bar closes. You pick. The indicator doesn't pick for you.
Why this matters: The manual version of this workflow — comparing Donchian structures across two or three timeframes — burns real minutes during a session. Minutes arranging charts and cross-referencing levels instead of actually reading the structure. The less obvious cost is harder to spot: if any of those HTF overlays was painting values that didn't exist at the time, every conclusion you drew from that comparison sits on data you can't go back and check. Consolidating the stack into one overlay and making the repaint behavior an explicit choice addresses both — the time spent and the question of whether you can trust what the chart showed you.
Features
Three independent Donchian Channel slots Each slot calculates its own upper boundary (highest high), lower boundary (lowest low), and basis line (smoothed midpoint) at a configurable timeframe. Defaults are 5-minute, 15-minute, and 60-minute. Each slot carries its own lookback length, MA type for basis smoothing, blend weight, and color coding (teal, blue, purple). Any slot can be enabled, disabled, or hidden independently.
Weighted blended channel Enabled slots feed into a composite fourth channel — a normalized weighted average of their upper, lower, and basis values. The blend tracks whatever emphasis you set through the per-slot weight controls. It plots in red with a shaded fill between upper and lower, and the composite basis appears in lime. The blend is a mathematical reflection of your configuration. It is not an independent measure of anything beyond what the individual slots already tell you.
Cross-ticker sourcing Any slot can draw its Donchian data from a different symbol. The indicator maps the alternate symbol's channel values into your chart's price space using a proportional close-price ratio. This lets you overlay, say, SPY's range structure on an individual stock — but the numbers on the axis are proportionally scaled, not the alternate symbol's actual price levels.
Repaint control in one switch "On Bar Close?" is a global toggle. When it's on, every slot reads the previous HTF bar's finalized values. When it's off, every slot reads the current forming bar. The setting applies to all three slots and to the cross-ticker scaling ratio at the same time. No per-slot exceptions.
Basis MA routing Each slot's midpoint smoothing runs through the Axiom Moving Average Library, supporting multiple MA types including SMA, EMA, and ALMA. At the default basis MA length of 1, no smoothing is applied — the basis is the raw Donchian midpoint.
18 alert conditions
Nine per-slot basis regime alerts (three per slot), seven blended channel alerts covering regime shifts and boundary crosses, and two multi-slot alignment alerts. All fire on confirmed bar close only. These are alertcondition() alerts — they work with TradingView's standard alert dialog but don't support custom webhook payloads or advanced message templates.
How to use
- Add the indicator to any chart. Three DC slots activate by default at 5m, 15m, and 60m, with "On Bar Close?" enabled and the blend turned on.
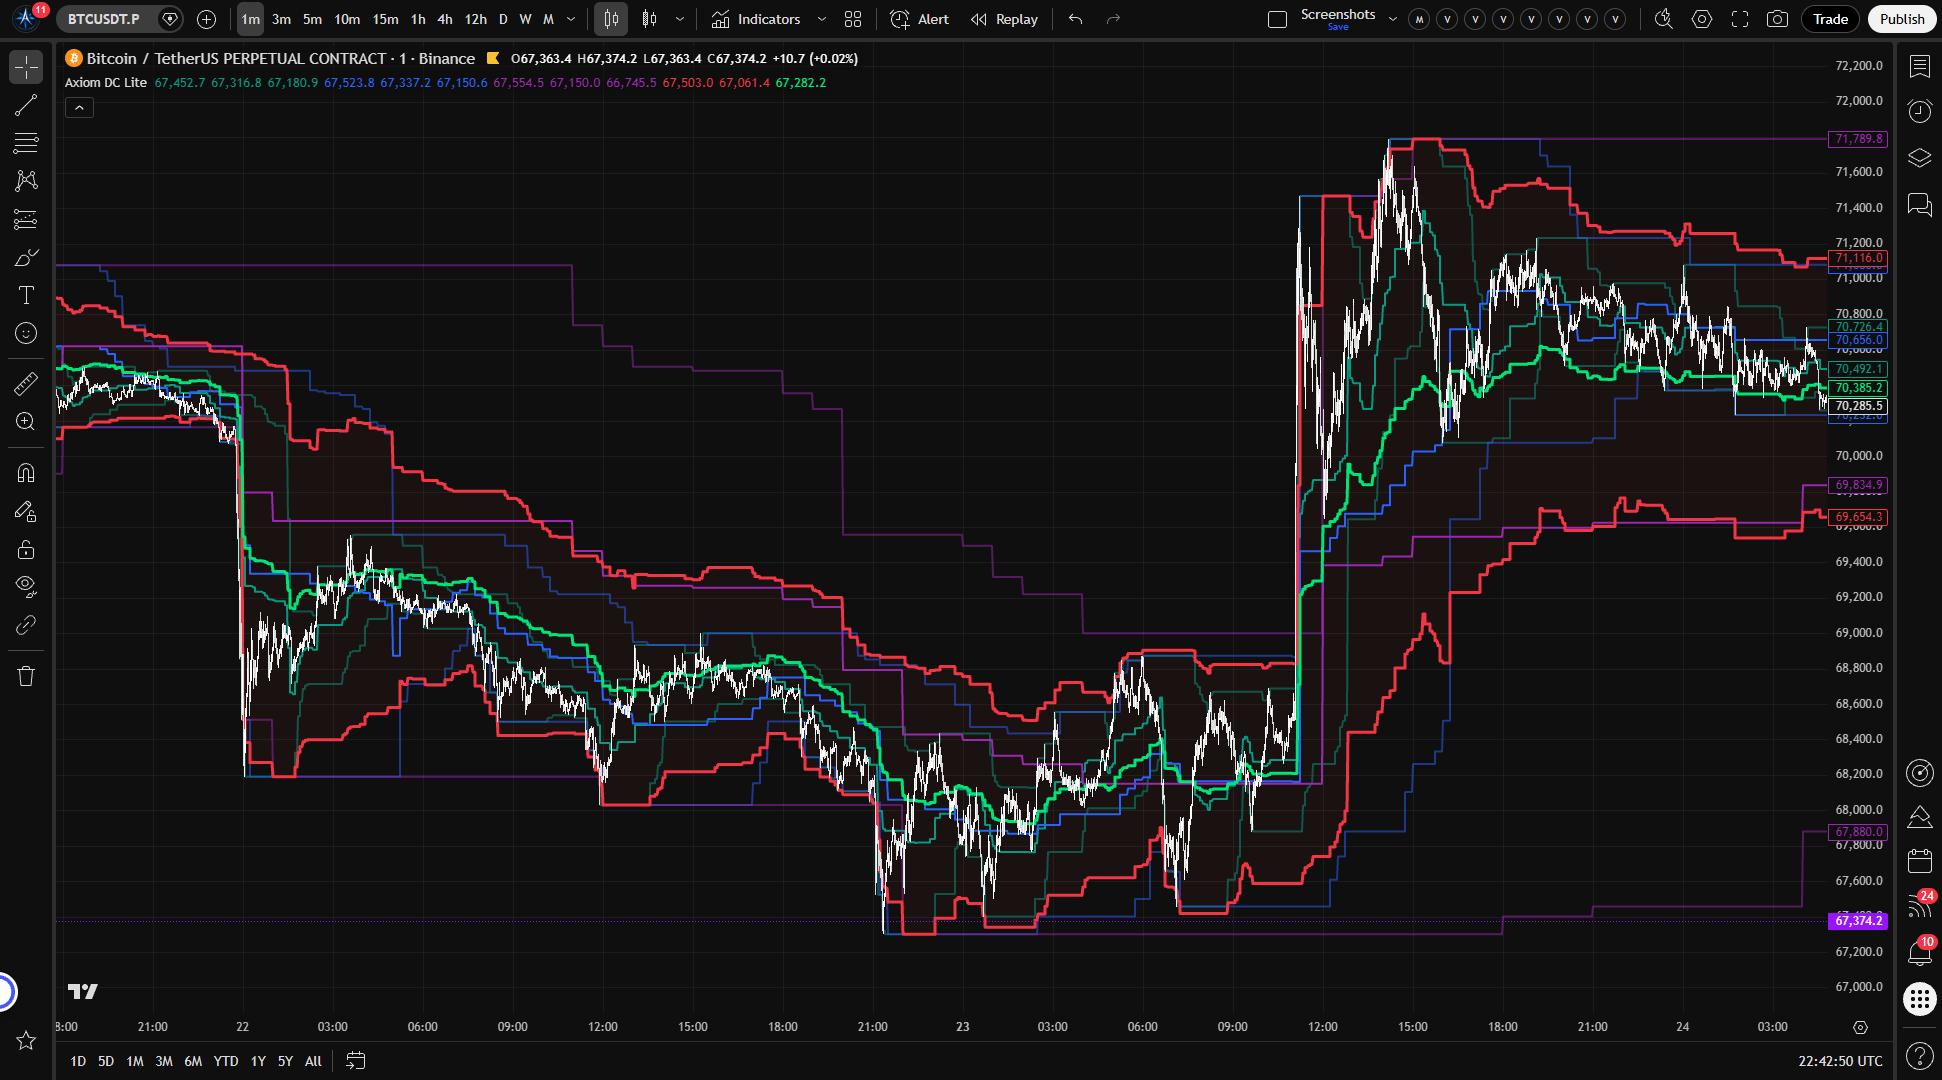
- On a 1-minute chart, you should see three color-coded channel sets (teal, blue, purple), a red blended channel with fill, and a lime blended basis line.
- Check that the blended channel falls between the individual slots' boundaries. The blend should lean toward whichever slots carry more weight (40 / 35 / 25 by default).
- If your chart timeframe is above 5 minutes, raise each slot's timeframe accordingly. Every slot timeframe must be at or above the chart's own timeframe — the indicator halts with a runtime error if it isn't.
- To verify repaint behavior: toggle "On Bar Close?" off on a live session and watch the values shift within an HTF bar. Toggle it back on and confirm that the plotted history holds steady.
What correct first use looks like: Three layered channel sets at increasing timeframe widths, each in its own color, plus a clearly separate red/lime blended overlay. Price sits within or near the channel structure. No blank gaps or missing values on a chart with sufficient bar history.
Settings
Per-slot settings (DC 01 / DC 02 / DC 03)
All three slots share an identical settings layout. Defaults shown as DC 01 / DC 02 / DC 03 where they differ.
Enable DC [N] (default: on / on / on) Controls whether the slot runs and feeds into the blend. Turn off slots you don't need. Disabling every slot while the blend is still on produces a flat zero output — technically safe, practically useless.
Hide DC [N] Plot (default: off) Hides the slot's chart lines without disabling it. The slot still contributes to the blend. Helpful for reducing clutter when you only want the composite view, but easy to forget — a hidden slot is still shaping the blended channel.
TimeFrame (default: 5 / 15 / 60) The higher timeframe for that slot's Donchian calculation. Match these to the timeframes you actually work with. A slot timeframe below the chart timeframe triggers a runtime error.
Length (default: 20 / 20 / 20) The Donchian lookback, measured in bars on the slot's timeframe. Shorter values tighten the channel and react faster. Longer values widen it and smooth out noise. Below about 5, the boundaries start tracking individual bars instead of structural ranges.
Basis MA Length (default: 1 / 1 / 1) Smoothing applied to the Donchian midpoint. At 1, there's no smoothing — the basis is the raw midpoint. Increase if you want a more gradual regime reference.
Type (default: SMA / SMA / SMA) The MA algorithm for basis smoothing, routed through the Axiom Moving Average Library. At short basis lengths most MA types behave similarly. The choice matters more as you increase the basis MA length.
Blended Weight (default: 40 / 35 / 25) How much this slot influences the blended channel. The blend normalizes across all enabled slots, so the ratios between the weights matter more than the absolute numbers. Setting all enabled slots to zero produces a zero-division-safe but meaningless composite.
Optional Ticker (default: empty) An alternate symbol for this slot's DC data. When the script can compute a valid close-price ratio, it scales that slot into your chart's price space. The overlay represents structural correspondence, not the alternate symbol's literal price levels. If the ratio cannot be formed cleanly, the script does not blank the slot out for you; it falls back to the alternate symbol's raw channel values, which can throw the overlay off-scale.
Line Width (default: 2 / 2 / 2) Visual preference. No functional effect.
Blended channel settings
Enable Blended DC (default: on) Whether the composite channel is calculated and displayed. Turn off when individual slots are enough.
Hide Blended DC Plot (default: off) Hides the blended lines and fill. The blend still computes in the background — useful if you only care about the blended alerts.
Line Width (default: 3) Visual preference.
Power-user settings
On Bar Close? (default: on) The single most important setting on this indicator. When on, all slots use confirmed HTF bar values. Historical data stays stable. When off, slots read the current forming HTF bar — faster updates, but historical values can shift. This is global: it applies to every slot and to cross-ticker scaling at the same time.
ALMA Floor Offset? (default: off) Floors the ALMA offset parameter to the nearest integer. Only relevant if ALMA is your basis MA type.
ALMA Offset (default: 0.85) / ALMA Sigma (default: 6.0) ALMA-specific tuning parameters. Only matter when ALMA is selected as the basis MA type. Leave at defaults unless you have a reason to change ALMA's weighting behavior.
Alerts
All 18 alert conditions evaluate on confirmed bar close only. They use alertcondition() — compatible with TradingView's standard alert setup, but not with custom webhook payloads or advanced message formatting. Alert messages include {{ticker}} and {{interval}} template placeholders.
Per-slot basis regime (3 per slot — 9 total)
| Alert | Fires when |
|---|---|
| DC [N] Is Above Basis | Confirmed close is at or above the slot's basis |
| DC [N] Is Below Basis | Confirmed close is below the slot's basis |
| DC [N] Basis Change | Above/below-basis regime flipped on the latest confirmed bar |
Blended channel (7 total)
| Alert | Fires when |
|---|---|
| Blended DC Is Above Basis | Confirmed close is at or above the blended basis |
| Blended DC Is Below Basis | Confirmed close is below the blended basis |
| Blended DC Basis Change | Blended above/below-basis regime flipped on the confirmed bar |
| Blended DC Crossed Above Upper Channel | Price crossed above the blended upper on the confirmed bar |
| Blended DC Crossed Below Lower Channel | Price crossed below the blended lower on the confirmed bar |
| Blended DC Crossed Above Basis | Price crossed above the blended basis on the confirmed bar |
| Blended DC Crossed Below Basis | Price crossed below the blended basis on the confirmed bar |
Multi-slot alignment (2 total)
| Alert | Fires when |
|---|---|
| All DC Slots Above Basis | Every enabled slot has confirmed close at or above its own basis |
| All DC Slots Below Basis | Every enabled slot has confirmed close below its own basis |
For the geeks
Two mechanics in this indicator are worth understanding past the settings level. Neither is complicated, but both are easy to misread if you don't know what's happening underneath.
Cross-ticker price-space scaling
When you assign a different symbol to a slot, the indicator computes a ratio between your chart symbol's close price and the alternate symbol's close price on the same HTF bar. It then multiplies the alternate symbol's Donchian values — upper, basis, lower — by that ratio to convert them into your chart's price units.
The result is a proportionally faithful rendering of the other symbol's channel structure. If the alternate symbol's Donchian Channel is wide relative to its own price, the scaled version will be proportionally wide on your chart too. But the dollar values on the y-axis belong to your chart, not to the alternate symbol.
There's a second-order effect worth knowing: when the price relationship between the two symbols changes quickly, the scale ratio moves, and the scaled channel shifts even if the alternate symbol's Donchian structure didn't change at all. That's not a bug — it's how proportional mapping works when the proportion itself is unstable.
You can check this yourself. Set a slot to an alternate ticker, then pull up a standalone chart of that ticker with matching DC settings. The shapes should correspond. The axis labels won't.
Confirmed HTF bar mode
The challenge with requesting higher-timeframe data in Pine is that TradingView can hand you values from a bar that hasn't finished yet. Your chart looks sharp on historical bars, but what it's showing is information that wasn't actually available at those points in time. That's the classic MTF repainting problem.
With "On Bar Close?" enabled, this indicator reads the previous HTF bar's completed values instead of the current bar's partial ones. The practical cost is straightforward: the channels trail by one HTF bar. On a 15-minute slot, that's up to 15 minutes of lag. On an hourly slot, up to an hour.
What you gain is that the chart doesn't lie about the past. If you scroll back to Tuesday afternoon, the Donchian boundaries you see are the boundaries that were visible on Tuesday afternoon. Nothing was filled in or revised after the fact.
To test it live: on a 1-minute chart with a 5-minute slot, watch in confirmed mode. The DC values should step once every five 1-minute bars. Switch to unconfirmed mode and the values will update within the 5-minute window — that intra-bar movement is the repainting you're opting into.
FAQ
Does this indicator repaint? Not with default settings. When "On Bar Close?" is on, every slot uses confirmed HTF bar values, and historical data holds still. If you switch that toggle off, values for recent bars can change until the higher-timeframe bar closes. The indicator puts this choice in your hands rather than making it behind the scenes.
What does the blended channel actually represent? It's a normalized weighted average of the active slots' upper, lower, and basis values, scaled by each slot's blend weight. It tells you what the combined slots produce when averaged — nothing more. If two of three slots agree and the third diverges, the blend lands somewhere between them, weighted accordingly. It doesn't have analytical significance beyond the configuration driving it. Running all slots on the same timeframe, for instance, makes the blend a weighted duplicate, not a confirmation signal.
Can I feed this into a strategy or use it for backtesting? The indicator does not generate trade signals or interact with Pine's strategy engine. You can reference its visual levels in your own workflow, but the tool measures range structure. It doesn't evaluate whether a channel boundary touch is an entry, an exit, or noise. If you're considering using the blended channel edges as mechanical trigger levels, understand that those edges are a summary of what you configured — they aren't independently validated reference points.
What happens when I point a slot at a different symbol?
The slot pulls Donchian data from that symbol and scales the result into your chart's price units through a proportional close-price ratio when that ratio is available. The overlay shows you structural shape and relative positioning, not the other symbol's actual prices. If the ratio cannot be formed cleanly, the script leaves the alternate symbol's raw channel values in place instead of forcing na, so the slot can look off-scale rather than simply disappearing.
Why do the channels seem to lag behind current price? That's the confirmed-bar tradeoff. When "On Bar Close?" is on, each slot waits for the HTF bar to finalize before it updates. The lag equals the slot's timeframe: five minutes on a 5m slot, an hour on a 60m slot. You're giving up speed so that historical values hold still after the fact. If you need tighter tracking and accept that recent values may change, turn the setting off.
Limitations
- This indicator measures Donchian Channel range structure. It does not assess trend quality, momentum, or volume, and it cannot tell you whether a break at a channel boundary will hold or fail. Every trading decision stays with the person reading the chart.
- Confirmed mode introduces a one-HTF-bar lag per slot. The wider the slot's timeframe relative to the chart, the more noticeable the delay. There is no way to eliminate the lag without accepting the repaint tradeoff.
- Cross-ticker scaling depends on a usable close-price ratio between the chart symbol and the alternate symbol. When the script cannot compute that ratio, it does not force
na; it leaves the alternate symbol's raw channel values in place, which can make the overlay look off-scale or misleading. - Every slot timeframe must be at or above the chart timeframe. The indicator enforces this with a runtime error. If you change chart timeframes, verify your slot settings still comply.
- The blended channel is a weighted average of your configured slots. It inherits their assumptions, their timeframes, and their limitations. Treating blend boundaries as standalone support or resistance levels overstates what the composite is actually measuring.
- Behavior on Renko, Heikin Ashi, and other non-standard chart types has not been verified.
Support and training
For documentation, walkthroughs, and direct support, visit the AxiomCharts website.
Disclaimer
This indicator is provided for educational and informational purposes only. It does not constitute financial advice, investment recommendations, or a solicitation to buy, sell, or hold any financial instrument. Trading carries substantial risk, including the potential loss of principal. Past performance and historical chart data do not guarantee future results. You are responsible for your own trading decisions. Use this tool as one input in your own research and analysis — not as a replacement for independent judgment or professional financial guidance.
Free access
Read everything on this page first. Open it on TradingView only when you are clear on what it does and what it does not do.
Open in TradingViewRelated products
If this one is close but not quite right, there may be a better fit nearby for the same kind of chart work, testing need, or workflow gap.
Keep looking
If this one is close but not quite right, there may be a better fit nearby for the same kind of chart work, testing need, or workflow gap.
Find your starting pointWeighing a few options against each other?
Tell us what you are trying to accomplish and we will help you narrow it down honestly.