indicator | Trend Analysis / Donchian Channels / Multi-Timeframe
Axiom DC Pro
Axiom DC Pro puts up to ten Donchian Channel slots on one chart, supports optional cross-ticker context, and blends the active structure into one weighted overlay. It is for traders who already use range boundaries as process and want more configuration depth without hidden repaint behavior.
Last updated: Apr 4, 2026
Crypto / Futures / Stocks / Forex / Indices | 1m / 5m / 15m / 1H / 4H / 1D
Best-fit markets
Primary timeframes
Product details
Explore the details to see whether the tool fits the problem you are trying to solve for.
Axiom DC Pro
Overview
If you trade with Donchian Channels, you have probably done this: flipped to a 5-minute chart to check one channel, switched to the 15-minute for another, then pulled up the hourly to see whether the broader structure agreed or disagreed. By the time you assembled the picture, the picture moved.
Axiom DC Pro puts up to 10 independent Donchian Channel slots on a single chart. Each slot runs at its own timeframe, with its own lookback length, its own basis smoothing, and its own blend weight. An optional blended channel takes the weighted consensus of the enabled slots that actually carry non-zero weight and draws it as a single structural envelope so you can read multi-timeframe agreement without doing the math in your head.
Each slot also supports an alternate ticker, so you can pull a foreign symbol's Donchian structure into your chart's price space for cross-market context.
Who this is for. Traders who already know what a Donchian Channel measures and have a reason to watch more than one timeframe at once. You should be comfortable configuring each slot with intention — choosing specific timeframes and weights that match how you actually analyze — rather than accepting defaults forever.
Who this is not for. If you want a buy/sell signal indicator, this is not that. If you have never used a Donchian Channel and want something that requires zero setup, start somewhere simpler. This tool rewards deliberate configuration, not passive consumption.
The trust question, directly. Every slot has its own On Bar Close toggle. When it is on (the default), the slot uses confirmed higher-timeframe values only. What you see on your historical chart is what you would have seen live. You can turn it off for faster updates, but the cost is real: the channel can shift within the current HTF bar, and backtests against those values are not reliable. The choice is yours, per slot, and the tradeoff is explicit.
Why this matters. Most multi-timeframe overlays on TradingView fall into one of two failure modes. Either they repaint without telling you — so the clean historical picture was never real — or they limit you to a single channel on a single timeframe, leaving you to toggle between charts and assemble alignment by memory. Both waste time. Both make it harder to trust what you see on the chart. We built this indicator after hitting both problems often enough that the workarounds stopped being worth the effort.
Features
Per-slot Donchian Channels (up to 10)
Each slot computes a standard Donchian Channel — the highest high and lowest low over a configurable lookback period — at the timeframe and on the ticker you specify. The basis line (midpoint between upper and lower) can be smoothed with any MA type available in the Axiom Moving Average Library, including SMA, ALMA, KAMA, FRAMA, Jurik, Laguerre, and VAMA.
Defaults enable three slots: a 5-minute channel (teal), a 15-minute channel (blue), and a 60-minute channel (purple). Seven more are available when you need them. Each slot has its own color, its own line width, and its own visibility toggle — you can hide a slot's plot while keeping it active in the blend.
Weighted blended channel
When enabled, the blended channel draws a single upper, basis, and lower line representing the weighted consensus of the active slots that actually carry non-zero weight. The blend is not itself a Donchian Channel — it does not compute a highest high or lowest low across a combined dataset. It is a proportional average of each slot's values, weighted by the importance you assign to each timeframe.
The default blend weights (40 / 35 / 25 across the three default slots) reflect a heavier emphasis on the shorter-timeframe structure. Adjust them to match your own thesis. Set a slot's weight to zero and it still plots individually but drops out of the blend.
Cross-ticker overlays
Any slot can pull its Donchian Channel data from a different symbol. When it does, the foreign channel values are scaled into your chart's price space using a close-price ratio so the overlay sits on the same axis as your main symbol. This is a relative projection that updates each bar as the price relationship shifts — not a fixed conversion and not a direct comparison.
Confirmed-bar alert system
Every alert fires only on confirmed chart bars, regardless of the On Bar Close setting. Per-slot alerts expose separate Above Basis, Below Basis, and Basis Change conditions. Blended alerts do the same for the blended basis. Alignment alerts fire when every enabled slot with a valid basis agrees — all above basis, or all below. Blended cross alerts fire when price crosses the blended upper, lower, or basis lines.
How to use
- Add the indicator to any chart. A 1-minute chart is a good starting point for verification because the default timeframes (5m, 15m, 60m) will all be above it.
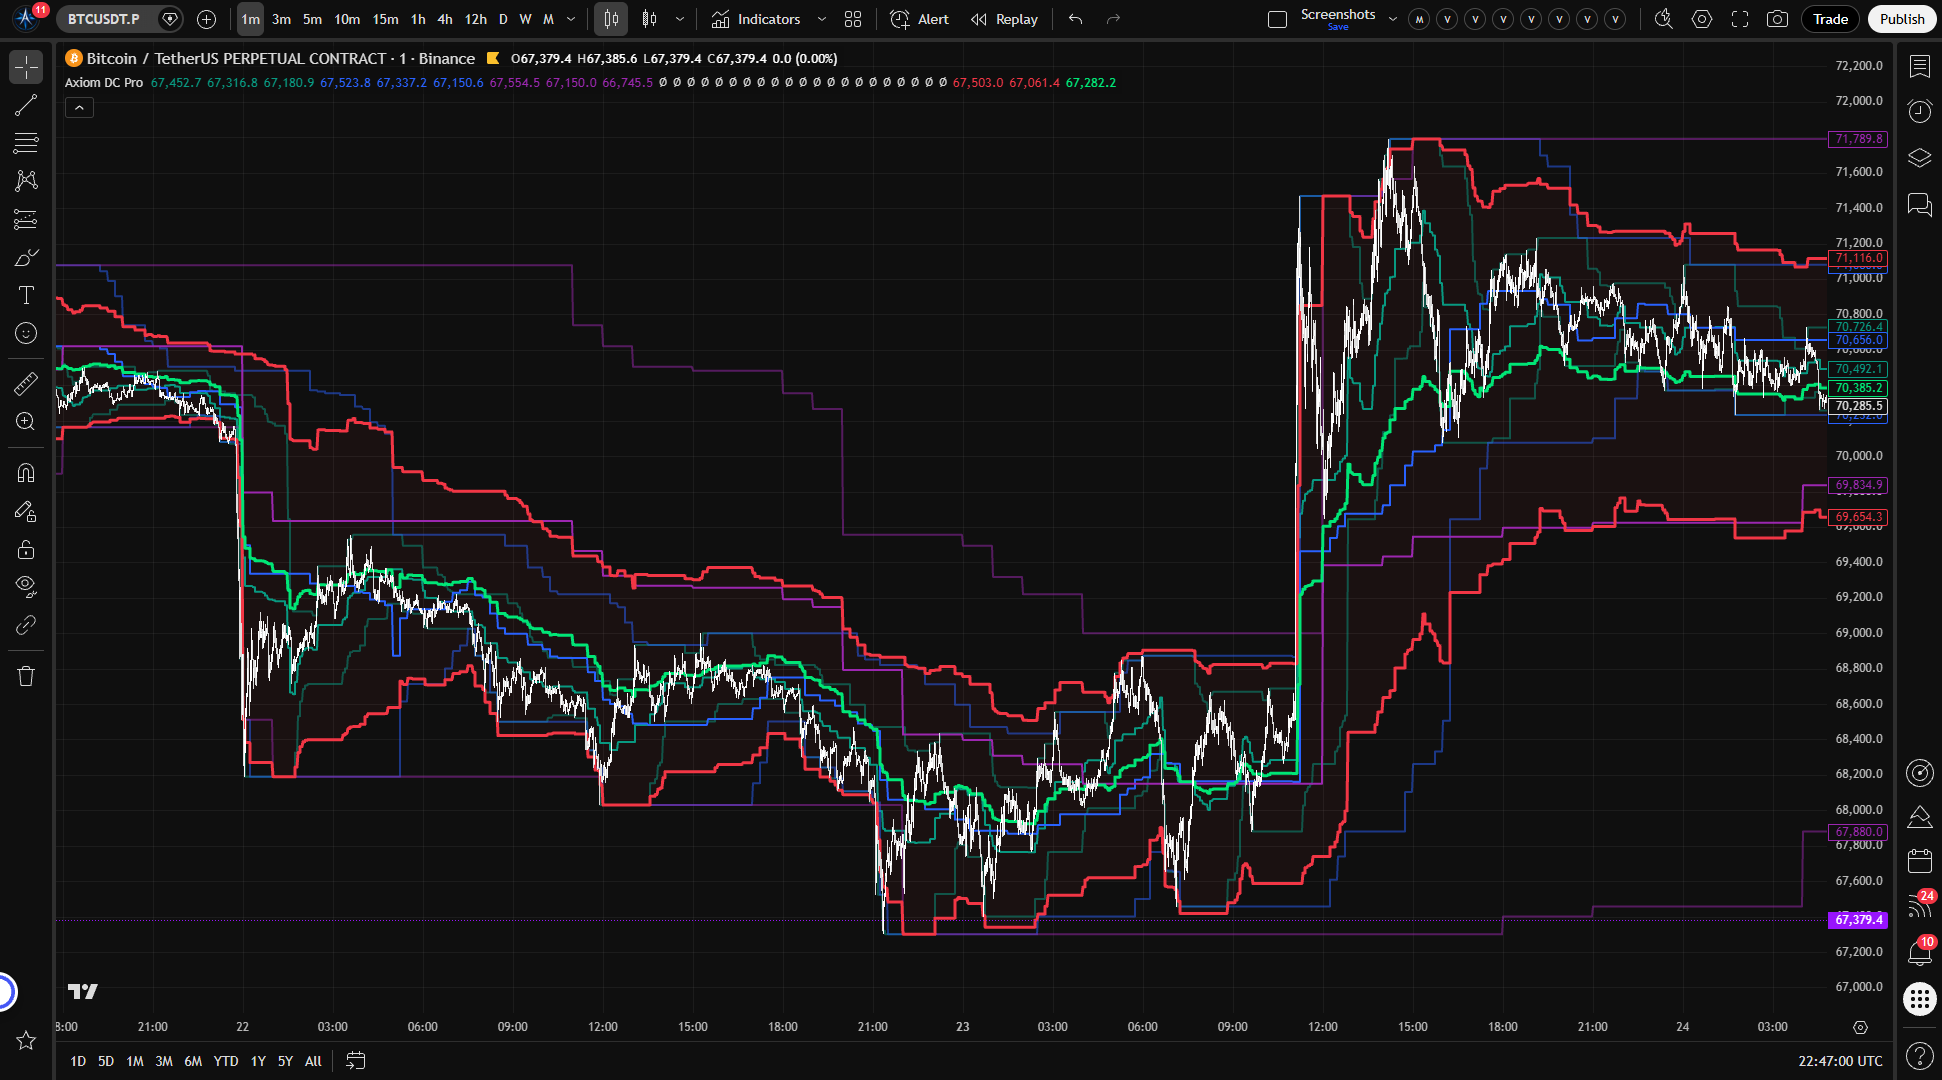
- You should see three channel sets in distinct colors (teal, blue, purple) plus a red blended channel with a lime basis line and a light red fill between the blended upper and lower.
- Verify the setup: the 5-minute slot's channel should match what you would see if you switched to a 5-minute chart and applied a standard 20-period Donchian Channel natively. Account for one bar of lag — On Bar Close is on by default, so the slot uses the previous confirmed HTF bar.
- If you are on a higher chart timeframe (say 15 minutes), make sure no slot is configured for a lower timeframe (say 5 minutes). The indicator will throw a runtime error and tell you which slot caused it.
What correct first use looks like: three layered channel structures at different scales, with the red blended envelope sitting as a weighted summary of the three. The individual channels show where structure lives at each timeframe. The blend shows where they converge.
Settings
What to set first
| Setting | Default | What it does | When to change it |
|---|---|---|---|
| Enable DC XX | Slots 01-03 on, 04-10 off | Turns the slot on or off entirely, including its contribution to the blend | Enable more slots when your analysis calls for additional timeframe or ticker layers. More is not automatically better — enable what you have a reason to watch. |
| TimeFrame | "5" / "15" / "60" for defaults; chart TF for the rest | The timeframe the slot computes its channel on | Match each slot to a timeframe that plays a role in your process — execution, structure, bias, or whatever framework you use. Never set a timeframe lower than the chart timeframe. |
| Length | 20 | Donchian lookback period in bars at the slot's timeframe | Shorter lengths react faster, longer lengths show broader structure. Different markets and timeframes may suit different lengths. |
| Blended Weight | 40 / 35 / 25 for defaults; 0 for the rest | How much each slot pulls the blended channel toward its values | Increase on the timeframes you trust most for your thesis. Set to 0 to keep the slot's plot without it affecting the blend. |
| On Bar Close? | On | Whether the slot uses confirmed (previous bar) or currently building HTF values | Turn off only if you need the channel to update before the HTF bar confirms, and you accept that the values may shift and backtests against them are unreliable. |
What to adjust later
| Setting | Default | What it does | Watch out for |
|---|---|---|---|
| Hide DC XX Plot | Off | Hides the slot's lines on chart but keeps it active in the blend | A hidden slot still affects the blended channel. To remove it from the blend, disable the slot or set its weight to zero. |
| Basis MA Length | 1 | Smoothing applied to the channel midpoint | High values cause the basis to lag behind the upper and lower bounds, which can create a misleading visual. |
| Type (Basis MA) | SMA | Which MA algorithm smooths the basis | This only affects the basis line — the upper and lower bounds remain raw Donchian values regardless of what you pick here. |
| Optional Ticker | Empty (chart symbol) | Pulls channel data from a different symbol and scales it into chart price space | The scaling uses a close-price ratio that shifts each bar. This is a relative overlay, not a fixed comparison. |
Power-user parameters
The basis MA type selection opens access to algorithm-specific parameters — ALMA offset, sigma, and floor; KAMA and FRAMA fast/slow periods; Jurik phase and power; Laguerre alpha; VAMA volatility length. These are only active when the corresponding MA type is selected for a slot's basis. If you do not know what they do, the defaults are solid starting points.
Alerts
All alerts fire on confirmed bars only. Set TradingView alert frequency to Once Per Bar Close for behavior that matches the on-chart conditions.
Per-slot alerts (available for each enabled slot):
- Above Basis / Below Basis — fires when price closes at or above (or below) the slot's basis line.
- Basis Change — fires when the price-to-basis relationship flips from the previous bar.
Blended channel alerts:
- Above Basis / Below Basis — same logic, applied to the blended consensus basis.
- Basis Change — the blended relationship flipped.
Alignment alerts:
- All DC Slots Above Basis — every enabled slot has price at or above its basis. Full-stack bullish posture.
- All DC Slots Below Basis — every enabled slot has price below its basis. Full-stack bearish posture.
Blended cross alerts:
- Crossed Above/Below Upper Channel — price crossed the blended upper line.
- Crossed Above/Below Lower Channel — price crossed the blended lower line.
- Crossed Above/Below Basis — price crossed the blended basis line.
For the geeks
Two mechanics in this indicator work differently than a standard Donchian Channel, and both are worth understanding before you lean on them.
The blended channel is not a Donchian Channel. A standard DC computes the highest high and lowest low over a lookback period. The blended channel does not do that. It takes the upper, basis, and lower values from each enabled slot with a non-zero weight, weights them by the blend weight you assigned, normalizes to total weight, and averages them independently. The result is a proportional consensus of separate channels — not a new highest-high/lowest-low calculation. If you assumed the blended upper was "the highest high across all timeframes," that assumption is wrong, and now you know.
Cross-ticker scaling is a relative projection. When a slot pulls from a different symbol, the raw channel values are in that symbol's price space. The indicator maps them into your chart's price space using a ratio derived from the two symbols' closes. That ratio shifts every bar as relative prices move. The overlay shows you where the foreign channel structure sits relative to your chart — it is not a fixed-rate conversion and should not be read as one.
Verify both yourself. Set two slots with known weights, compute the expected blend by hand, and compare to the chart. For cross-ticker, check whether the ratio of chart close to foreign close at the relevant timeframe explains the mapped levels.
FAQ
Does this indicator repaint?
It depends on a setting you control. When On Bar Close is on (the default for every slot), the indicator uses confirmed higher-timeframe bar values only. What you see on history is what you would have seen live. When On Bar Close is off, the slot uses the currently building HTF bar, which means the values can change before that bar closes. Backtests against values produced with On Bar Close off are not reliable.
What is the blended channel actually computing?
A weighted average of each enabled slot's upper, basis, and lower values, as long as that slot is carrying a non-zero weight — not a new Donchian Channel calculation. See the "For the geeks" section above for the full explanation.
Can I use the blended channel as a buy/sell signal?
No. The blended channel shows where your configured timeframes structurally agree. It is a reference layer, not an entry signal. It does not tell you which direction to trade, when to enter, or when to exit.
What happens if I set a slot's timeframe lower than my chart timeframe?
The indicator throws a runtime error and identifies which slot caused it. This script is built for same-timeframe-or-higher requests only, so any lower-timeframe slot has to be raised to the chart timeframe or disabled.
How does the cross-ticker overlay work — is it a direct price comparison?
No. The foreign symbol's channel values are scaled into your chart's price space using a ratio of the two symbols' closing prices. That ratio updates every bar, so the overlay shifts as the price relationship between the two symbols changes. It is a relative projection, not a fixed conversion.
Limitations
- Repaint risk is opt-in but real. Turning On Bar Close off for any slot means that slot's channel values can change within the current higher-timeframe bar. Backtests against those values will not match what was visible in real time. The default (on) avoids this, but if you turn it off, own the tradeoff.
- Slot timeframes must be at or above the chart timeframe. A 5-minute slot on a 15-minute chart will produce a runtime error. There is no graceful fallback — the indicator stops and tells you which slot is misconfigured.
- The blended channel can mask divergence. When individual slots disagree sharply, the weighted average splits the difference. That average can look calm while the underlying timeframes are in conflict. Watch the individual slot channels alongside the blend, especially when the blend is flat but individual channels are pulling apart.
- Blend weights are not clamped in code. Zero weight cleanly excludes a slot from the blend, but negative weights are still accepted by the script. If you use them, the blend can move outside the visible slot channels or collapse to zero when the total weight mix goes non-positive.
- Cross-ticker scaling is not a fixed conversion. The close-price ratio changes every bar. Over time, the mapped levels drift relative to what you would see if you charted the foreign symbol directly. It is useful for structural context, not for precise level-matching.
- More slots are not automatically better. Ten slots exist for traders who have ten distinct layers to watch. If you enable all of them without a structural reason, you add noise, not clarity.
- This is not a signal tool. The indicator maps Donchian Channel structure across timeframes. It does not generate entries, exits, or directional calls. The work of deciding what to do with that structure is still yours.
Support and training
For setup guidance, feature walkthroughs, and configuration help, visit the AxiomCharts website. If something is not working the way the documentation says it should, reach out through the support channels listed there.
Disclaimer
This indicator is an educational and analytical tool. It does not constitute financial advice, trading recommendations, or a solicitation to buy or sell any financial instrument. Past performance of any trading setup, indicator reading, or channel configuration does not guarantee future results. All trading involves risk, including the risk of loss. You are solely responsible for your own trading decisions and should consult a qualified financial professional before acting on any information derived from this tool.
Related products
If this one is close but not quite right, there may be a better fit nearby for the same kind of chart work, testing need, or workflow gap.
Keep looking
If this one is close but not quite right, there may be a better fit nearby for the same kind of chart work, testing need, or workflow gap.
Find your starting pointWeighing a few options against each other?
Tell us what you are trying to accomplish and we will help you narrow it down honestly.