indicator | Trend Analysis / Moving Averages / Multi-Timeframe
Axiom MA Lite
Axiom MA Lite stacks up to three moving averages across separate higher timeframes, blends them into one optional composite, and makes the repaint tradeoff a visible choice. It is for traders who already use moving averages for bias and want honest multi-timeframe structure, not another signal toy.
Last updated: Apr 4, 2026
Crypto / Futures / Stocks / Forex / Indices | 1m / 5m / 15m / 1H / 4H / 1D
Best-fit markets
Primary timeframes
Product details
Explore the details to see whether the tool fits the problem you are trying to solve for.
Axiom MA Lite
Overview
Stacking moving averages across timeframes is straightforward until you need to trust the result. Most multi-timeframe MA overlays on TradingView pull higher-timeframe data without guarding against the building bar — so the values on your historical chart include information that wasn't actually available at the time. Your backtest looks clean. The live experience doesn't match.
Axiom MA Lite runs up to three moving averages across separate higher timeframes in one overlay and combines them into a weighted blend. Each slot defaults to confirmed bar values, so what you see on historical bars is what was available at the time. Faster updates from the building bar are there if you want them — but the indicator makes that an explicit choice, not a hidden default.
Who this is for: Traders who already know what moving averages do and want to layer timeframe bias across multiple MAs without managing separate indicators or second-guessing their chart history.
Who this is not for: Anyone looking for buy/sell signals, automated entries, or a tool that works without understanding the settings. This shows where trend agreement stands across timeframes — not what to do about it.
The trust boundary: With the default "On Bar Close?" setting enabled, the MA values come from the last completed higher-timeframe bar. Historical values are stable and safe to reference. If you disable that setting for faster updates, the MA uses the bar still forming — historical values can change, and backtests against that mode are not reliable.
Features
Three independent MA slots
Each slot runs its own moving average on its own higher timeframe. By default, slot 01 pulls from a 5-minute timeframe, slot 02 from 15-minute, and slot 03 from 60-minute. Each slot is independent — you choose the MA type, length, source, timeframe, and trend lookback separately.
The MA type routes through the Axiom Moving Average Library Lite, which supports eight types: SMA, EMA, RMA, WMA, VWMA, HMA, ALMA, and SWMA. The default is SMA across all three slots.
Each slot's line is colored by trend direction — a brighter shade when the MA is rising over its trend lookback, a more muted shade when it's falling. Slot 01 runs in teal, slot 02 in blue, and slot 03 in purple. You can read the per-slot trend state at a glance without checking values.
Optional cross-ticker override
Each slot can pull its data from a different instrument. If you set an alternate ticker on a slot — say, SPY on a crypto chart — the indicator computes the MA on that instrument's data and scales it into your chart's price range so the line sits where you can actually read it. The scaling is approximate (more on that in the "For the geeks" section below). It keeps the line readable, but the plotted slope can still be distorted by the ratio between the two instruments.
Blended MA line
When enabled, the indicator combines all enabled, non-zero-weight slot values into a single weighted-average line. Each slot's influence is governed by its blended weight setting — by default, each slot contributes equally at 33.3%. The blended line's trend color (lime for uptrend, red for downtrend) is determined by a weight-based vote: the indicator compares the total weight assigned to uptrending slots against the total weight of downtrending slots and calls the direction accordingly.
The blend is a summary, not an independent signal. It condenses agreement and disagreement across the stack into one reading. If two slots at 30% each disagree with one slot at 40%, the blend follows the 40% slot — so the individual slot readings are where the actual information lives. Watch the blend for a quick read, but check the slots before acting on it.
Timeframe enforcement
The indicator will not let you request a timeframe lower than your chart. If you're on a 15-minute chart and set a slot to 5 minutes, the script stops and tells you why. This prevents a category of silent errors that would produce misleading values without any visible warning.
How to use
- Add the indicator to a chart whose timeframe is at or below the lowest enabled slot timeframe. The defaults use 5m/15m/60m, so a 1-minute through 5-minute chart works out of the box.
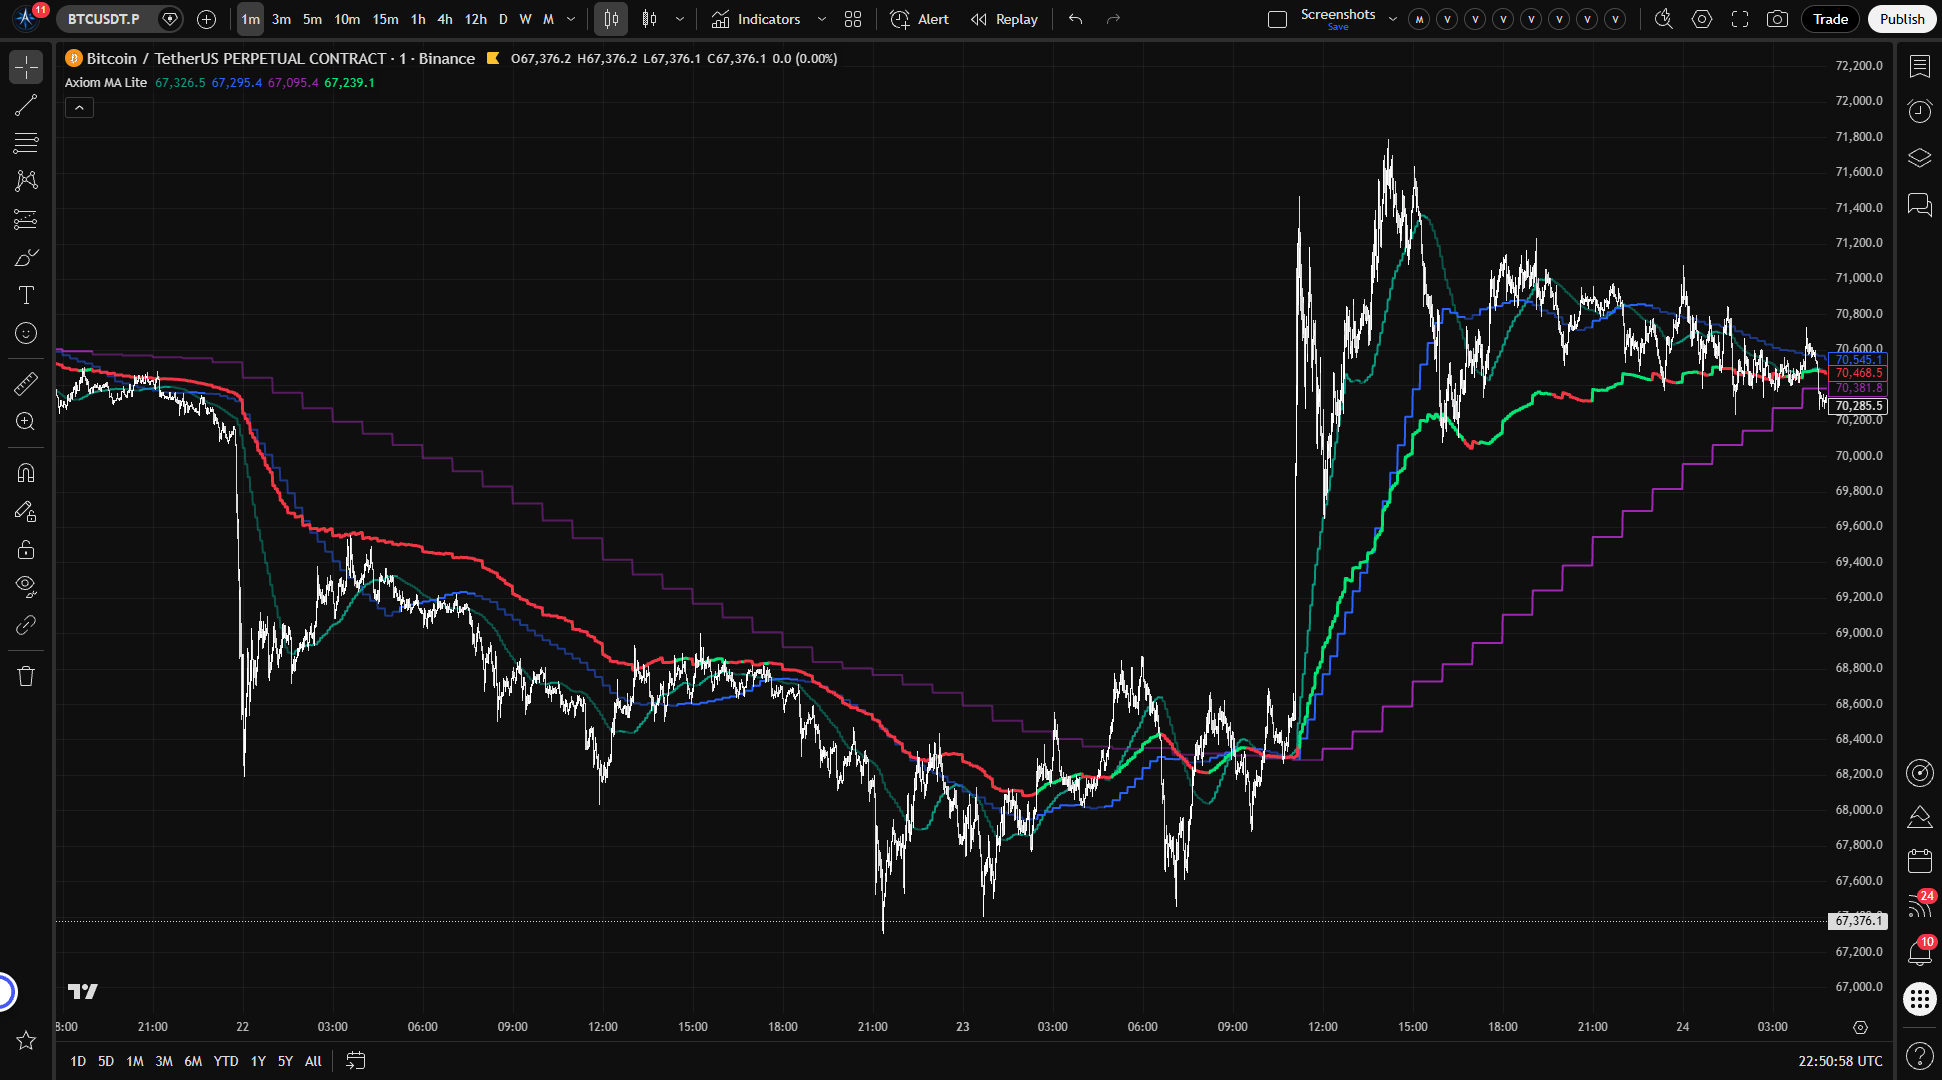
- You should see three MA lines — teal, blue, and purple — at progressively smoother levels (because they pull from higher timeframes), plus a blended line in lime or red.
- Confirm that "On Bar Close?" is enabled in the PU Settings group. It is on by default. With it on, the MA lines update in steps — each one holds its value until the next HTF bar closes, then jumps to the new reading. On a 1-minute chart with a 5-minute slot, you'll see this as stair-step behavior: the line holds for five bars, then updates.
- Adjust the slot timeframes, MA types, and lengths to match your own timeframe hierarchy. If you work on a 15m/1H/4H structure, set the three slots accordingly.
- To add cross-market context, enter a ticker symbol in a slot's "Optional Ticker" field. The MA will compute on that instrument's data and scale into your chart's price space.
What correct first use looks like: Three colored lines tracking across historical bars with no jumps, revisions, or inconsistencies. The lines look stable because they are — each one reflects only the information that was available at the time.
Settings
Per-slot settings (repeated for MA 01, MA 02, MA 03)
Enable — Turns the slot on or off. All three are on by default. Disabling a slot removes it from the chart and from the blended MA calculation. Disabling all three while the blend is enabled produces nothing useful.
Hide Plot — Hides the slot's line from the chart without removing it from the blend calculation. Use this when you want a slot to influence the composite line without adding visual clutter. Keep in mind that a hidden slot still affects the blended MA.
Source — The price series feeding the MA. Default is close. Changing it to high, low, or hl2 shifts where the line sits relative to price.
TimeFrame — The higher timeframe the slot pulls data from. Default is "5" for slot 01, "15" for slot 02, and "60" for slot 03. If the slot is enabled, it must be at or above the chart timeframe — the indicator throws a runtime error if you request something lower.
Length — The MA lookback period, counted in bars of the slot's timeframe. Default is 20. Shorter lengths produce noisier lines; very short lengths (below 5) mostly defeat the purpose of pulling from a higher timeframe.
Type — The MA algorithm: SMA, EMA, RMA, WMA, VWMA, HMA, ALMA, or SWMA. Default is SMA. If you select ALMA, the offset and sigma parameters in PU Settings become relevant — the other types ignore them.
Trend Length — How many bars back the indicator compares the current MA value to determine whether it's rising or falling. Default is 3. Higher values smooth out the trend reads; setting it to 0 disables trend detection for that slot (it always reads as downtrend, which is almost never what you want).
Blended Weight — How much this slot counts in the blended MA. Default is 33.3 (equal weight across all three). Setting a weight to 0 excludes the slot from the blend but keeps its standalone line and alerts intact. If you want the blend to favor one timeframe, increase that slot's weight relative to the others.
Optional Ticker — Leave empty to use the chart's symbol. Enter a ticker to pull that instrument's data for this slot instead. The resulting MA is scaled into chart price space using a ratio-based approach, which is approximate. If the two instruments' relative prices shift significantly, the scaling moves with them — it tracks direction well but is not an exact overlay.
Blended MA settings
Enable — Turns the blended line and its alerts on or off. Default is on. Disable if you only want the individual slot lines.
Hide Plot — Hides the blended line from the chart while keeping its alerts active.
Global PU settings
On Bar Close? — The most important setting in this indicator. When enabled (the default), all slots use the last completed higher-timeframe bar. Historical values match what was available in real time. When disabled, slots use the bar still forming — the MA updates faster but historical values can change after the fact. Do not disable this if you plan to reference historical chart behavior or use the indicator in any backtest context.
ALMA Offset — Controls the center-of-mass position for ALMA calculations. Default is 0.85. Only relevant when at least one slot is set to ALMA.
ALMA Sigma — Controls the bell-curve width for ALMA smoothing. Default is 6.0. Only relevant when at least one slot uses ALMA.
ALMA Floor Offset? — Floors the ALMA offset to the nearest integer. Off by default. A niche tuning option for ALMA users who want discrete offset steps.
Alerts
The indicator provides 14 alert conditions. All of them gate on the chart bar's confirmed close (barstate.isconfirmed), so the conditions never go true intrabar.
Per-slot alerts (for each of MA 01, MA 02, MA 03)
| Alert | Type | Fires when |
|---|---|---|
| MA 0X Is Uptrend | Continuous state condition | The slot's MA is rising over its trend lookback at bar close |
| MA 0X Is Downtrend | Continuous | The slot's MA is falling at bar close |
| MA 0X Trend Change | Edge-triggered condition | The slot's trend direction changed at bar close |
Blended MA alerts
| Alert | Type | Fires when |
|---|---|---|
| Blended MA Is Uptrend | Continuous | The blended MA's weighted trend vote is up at bar close |
| Blended MA Is Downtrend | Continuous | The weighted trend vote is down at bar close |
| Blended MA Trend Change | Edge-triggered | The blended trend direction flipped at bar close |
Global alignment alerts
| Alert | Type | Fires when |
|---|---|---|
| All MA Slots Uptrend | Continuous | Every enabled slot with a valid value is in an uptrend at bar close |
| All MA Slots Downtrend | Continuous | Every enabled slot with a valid value is in a downtrend at bar close |
Alert message placeholders
The indicator plots two hidden series — Active Uptrend Count and Active Downtrend Count — that don't appear on the chart but can be embedded in alert message templates. Use {{plot("Active Uptrend Count")}} and {{plot("Active Downtrend Count")}} to include the live count in your notification text.
A note on alerts and On Bar Close
All alerts wait for chart bar confirmation before firing. However, if "On Bar Close?" is disabled, the MA and trend values that the alert checks may have been computed from an HTF bar that was still forming. The alert fires at the right time, but the value it reports could shift on the next chart bar as the HTF candle develops. If alert reliability matters to you, keep On Bar Close enabled.
For the geeks
Cross-ticker price-space scaling
When you set a different ticker on a slot, the indicator computes the MA on that instrument's data at the slot's higher timeframe — same MA type, same length, same bar-close handling. The problem is that the resulting MA value sits in the foreign instrument's price range. A 20-period SMA of SPY might be around 530. On a BTC chart at 68,000, that line is invisible.
To make the foreign MA readable on your chart, the indicator scales it using a ratio of the two instruments' higher-timeframe closes. It takes the chart symbol's confirmed HTF close, divides it by the alternate ticker's confirmed HTF close, and multiplies the foreign MA by that ratio. The result lands in your chart's price neighborhood, but the plotted line is still being pushed by both the foreign MA and the ratio itself.
This is an approximation, not a mirror. The scaling ratio itself changes as the relative prices of the two instruments shift. If BTC rises 5% while SPY is flat, the ratio increases, and the scaled MA moves up slightly even if SPY's MA hasn't changed. The slot's trend state still comes from the foreign MA, but the plotted line's exact level and slope can drift as the price relationship changes.
How to verify: Set a slot to a well-known cross-pair (SPY on an ES chart, BTC on an ETH chart). Confirm the scaled line sits within your chart's price range. Pull up the foreign instrument on a separate chart with the same MA type and length. Compare the foreign MA's broad turns against the slot's color and general behavior, not the scaled line's exact slope. The plotted level will differ, and the ratio itself can bend the line.
FAQ
Does this indicator repaint?
With the default "On Bar Close?" setting enabled, no. Each slot returns the value from the last completed higher-timeframe bar. What you see on historical bars is what was available at the time. If you disable On Bar Close, the slots use the HTF bar still forming, and historical values can change as that bar develops. The default is the safe option. The faster option is there if you want it, but it sacrifices historical reliability.
What does "On Bar Close?" actually do?
It controls whether the indicator waits for the higher-timeframe bar to finish before using its value. When on, the MA holds its reading between HTF closes — you'll see stair-step updates, each one locked in. When off, the MA recalculates with every chart bar using the building HTF candle. The updates look smoother and faster, but the values you see on historical bars might not match what was actually available in real time. This setting applies globally to all three slots.
How does the blended MA work?
It takes each enabled slot's MA value, multiplies it by the slot's blended weight, adds them up, and divides by the total weight. If slot 01 has a weight of 60 and the others have 20 each, the blend sits much closer to slot 01's value. The trend color is decided separately: the indicator adds up the weight behind uptrending slots and compares it to the weight behind downtrending slots. Whichever side carries more weight determines the blend's trend direction. It's a weighted summary, not a recalculated signal — so the trend can flip even when the blended value itself hasn't moved much, if the weight balance shifts.
What happens when I set a different ticker on a slot?
The slot computes the MA on that instrument's data and scales the result into your chart's price range so the line is readable. The scaling uses a ratio of the two instruments' higher-timeframe closes, which means it tracks the foreign MA's direction accurately but not its exact value. If the two instruments' prices move apart significantly, the scaled line drifts proportionally. See the "For the geeks" section above for the mechanics and how to verify.
Can I use this as a buy/sell signal?
No. The indicator shows whether moving averages across your chosen timeframes are rising, falling, or split — and the blended line summarizes that picture. What that alignment means for a specific trade is not something the indicator can answer. That depends on your rules, your market context, and your risk management. Treating MA alignment as a mechanical entry trigger is a well-known way to overtrade.
Limitations
- The blended MA is a summary, not a signal. It compresses the per-slot picture into one value. Acting on the blend without understanding the individual slots underneath is working from a conclusion rather than evidence.
- Cross-ticker scaling is approximate. The ratio-based approach makes the foreign MA readable on your chart, but the plotted level and slope can drift as the two instruments' relative prices change. The slot's trend state is cleaner than the scaled line's exact shape.
- Disabling On Bar Close breaks historical reliability. With it off, the indicator uses the building HTF bar. Backtests and historical chart reads are not trustworthy in this mode. The setting exists for traders who want real-time responsiveness and understand the cost.
- Three slots, not unlimited. This script gives you three MA slots. If your workflow needs more than that, this script does not provide it.
- ALMA parameters apply globally. If you set one slot to ALMA and another to SMA, the ALMA offset and sigma values still live in the global PU settings. Changing them affects every slot that uses ALMA.
- SWMA has a fixed length of 4. This is a property of the symmetrically weighted moving average itself, not a limitation of the indicator. If you select SWMA, the length setting for that slot is overridden.
Support and training
Setup guides, documentation, and direct support are available on the AxiomCharts website.
Disclaimer
This indicator is an analytical tool for informational and educational purposes. It does not constitute financial advice, and nothing in this description or the indicator's output should be interpreted as a recommendation to buy, sell, or hold any financial instrument. Trading involves substantial risk of loss. Past chart behavior — including behavior displayed by this indicator — does not guarantee future results. You are solely responsible for your own trading decisions.
Free access
Read everything on this page first. Open it on TradingView only when you are clear on what it does and what it does not do.
Open in TradingViewRelated products
If this one is close but not quite right, there may be a better fit nearby for the same kind of chart work, testing need, or workflow gap.
Keep looking
If this one is close but not quite right, there may be a better fit nearby for the same kind of chart work, testing need, or workflow gap.
Find your starting pointWeighing a few options against each other?
Tell us what you are trying to accomplish and we will help you narrow it down honestly.