indicator | Oscillators / Moving Averages / Trend Proximity
Axiom MA Osc Lite
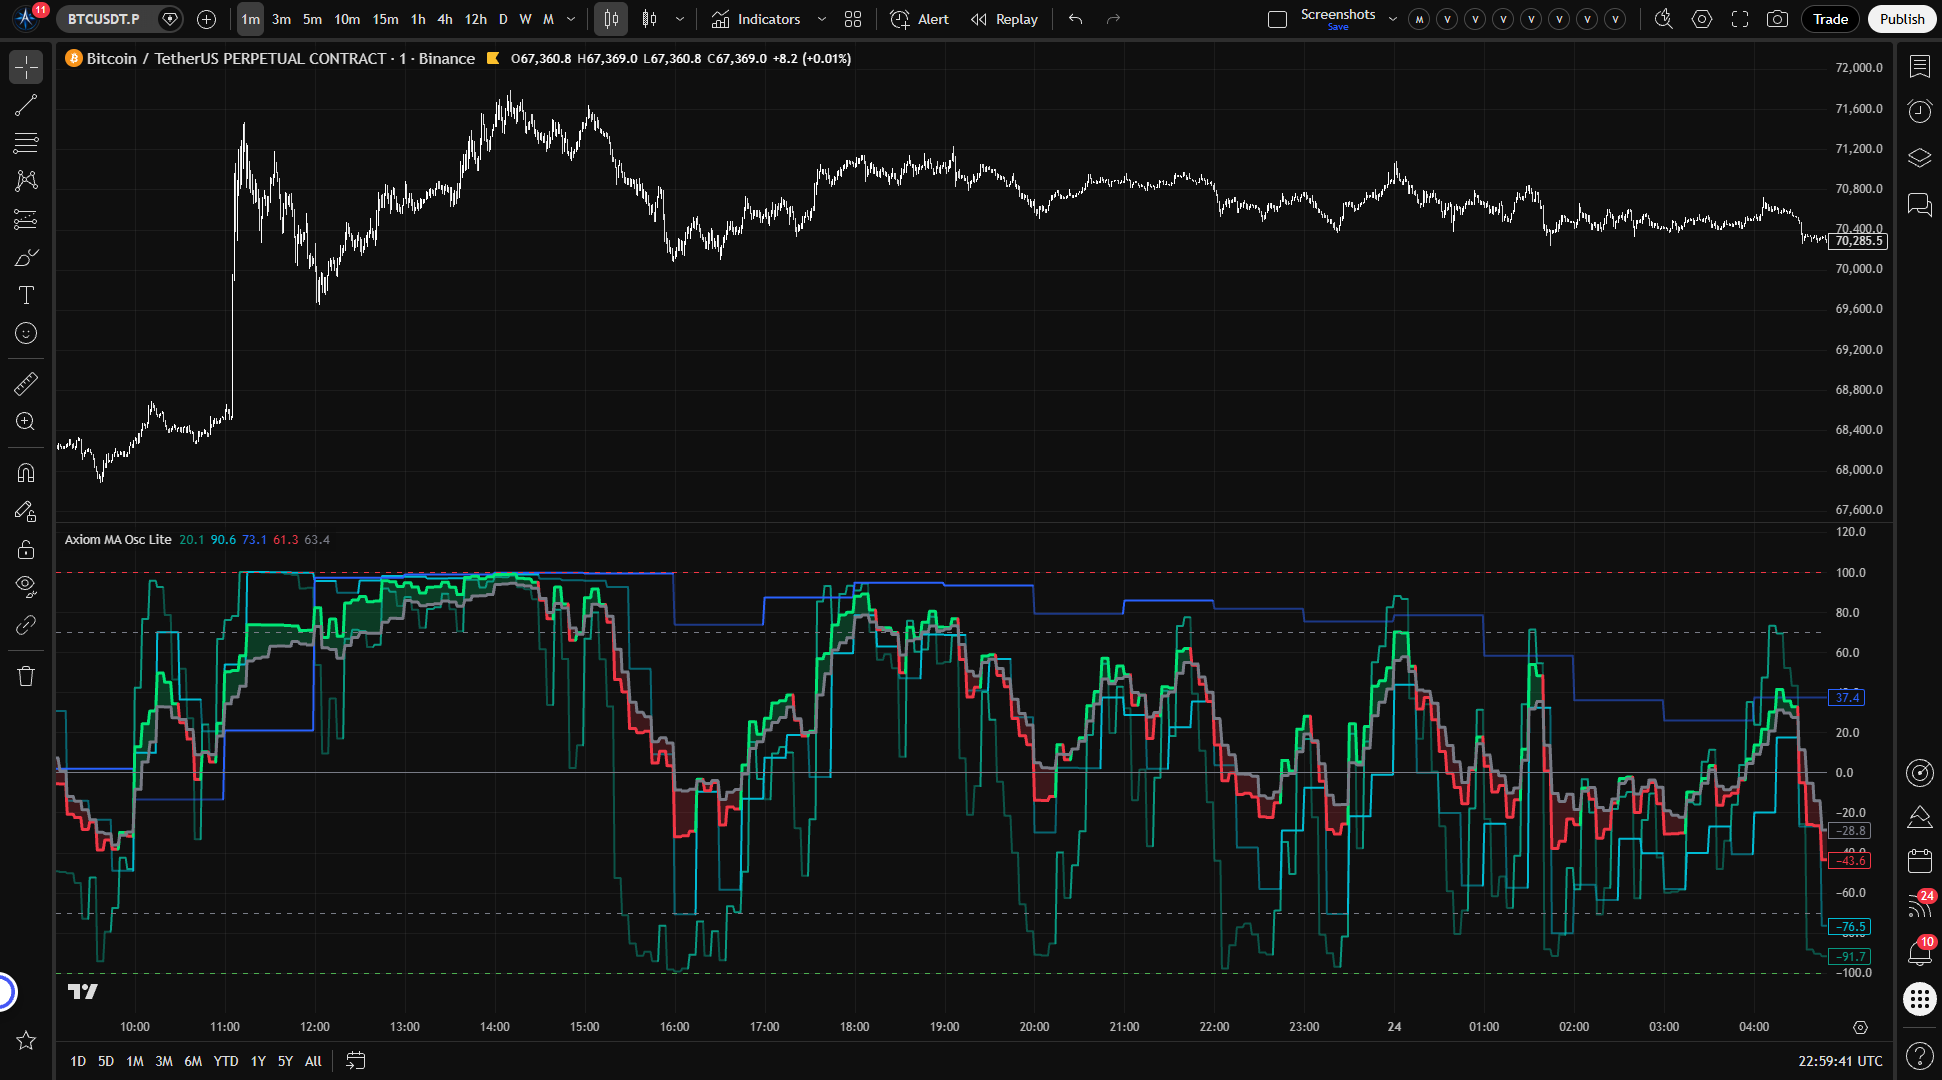
Axiom MA Osc Lite measures ATR-normalized distance from a moving average across up to three slots, compresses the readings onto one bounded scale, and keeps higher-timeframe stability explicit. It is for traders who use moving averages as structure and want one honest pane for cross-timeframe stretch, not automatic entries.
Last updated: Apr 4, 2026
Crypto / Futures / Stocks / Forex / Indices | 1m / 5m / 15m / 1H / 4H / 1D
Best-fit markets
Primary timeframes
Product details
Explore the details to see whether the tool fits the problem you are trying to solve for.
Axiom MA Osc Lite
Overview
"How far is price from its moving average?" is one of the most useful questions a trader can ask. It gets harder the moment you need the answer across more than one timeframe — or more than one instrument. The distances live in different price scales, move at different speeds, and shift with different volatility profiles. Comparing them by eye is guesswork dressed up as analysis.
Axiom MA Osc Lite takes that distance, normalizes it against the instrument's own volatility, and compresses it into a bounded reading between -100 and +100. It does this across up to three independent slots, each configurable to its own timeframe, ticker, and price source. The result is a single pane where all readings share the same axis and the same unit — regardless of what produced them.
What it measures: ATR-normalized distance between price and a moving average. Not momentum. Not direction. Distance — expressed in a way that stays comparable across whatever you point it at.
Who it fits: Traders who already use MAs as structural context across multiple timeframes and want that context compressed into one readable pane. People willing to choose their own MA types, timeframes, and blend weights. People who care whether their higher-timeframe readings come from confirmed or live bars.
Who it does not fit: Anyone expecting the oscillator to generate entries or exits on its own. Anyone looking for a single-setting, single-timeframe tool with nothing to configure. Anyone who assumes extreme readings automatically mean a reversal is coming.
The trust boundary to know up front: The output is not linear near the extremes. The saturation curve that keeps readings bounded also compresses them — equal-sized price moves produce progressively smaller changes as the oscillator approaches ±100. This is deliberate and useful, but if you assume linear scaling, you will misread the edges of the range.
Why this matters
Trend proximity is foundational context — but the reading turns into a liability when the scale drifts between timeframes, when a volatile instrument produces numbers that dwarf a quieter one, or when the higher-timeframe value silently updates from an unconfirmed bar.
This oscillator makes the distances comparable by measuring them in ATR units, keeps them readable by bounding the output, and puts the repainting decision in your hands with an explicit switch. Whether those readings add up to useful context depends on the timeframes and tickers you choose to combine.
Features
-
Three independent oscillator slots — each runs its own MA calculation on its own timeframe and ticker. Readings appear side by side in the same pane, on the same bounded scale. Disable any slot you are not using so it stays out of the blend and off the chart.
-
Per-slot Fast and Slow lines — Fast is the bounded ATR-normalized distance reading. Slow is a smoothed version of Fast. When Fast sits above Slow, the slot shows bullish regime coloring. When it drops below, bearish. The crossover marks the regime transition.
-
Weighted blended composite — enabled slots blend into a single Fast/Slow pair based on the weights you assign. The weights auto-normalize, so you can set them however you like and the proportions will hold. A fill between blended Fast and Slow gives you a quick read on the composite regime.
-
Configurable MA types — baseline and smoothing MAs for each slot draw from the full Axiom Lite MA Library: EMA, SMA, WMA, ALMA, and others. Choose the response profile that fits the timeframe and instrument.
-
Multi-ticker support — each slot can pull price and ATR data from a different symbol. The normalization keeps readings on the same scale even when the underlying instruments have completely different price levels and volatility.
-
Optional master smoothing — a final MA pass applied to the blended composite after weighting. Useful when the blended output is noisier than you want. Be aware that smoothing an already-smoothed signal adds lag.
-
On Bar Close repaint switch — the default (enabled) uses the last confirmed higher-timeframe bar, so historical values do not change after the fact. Turn it off and the output updates from the building bar, but the lower-timeframe bars inside that HTF interval are later backfilled with the finalized value. This is a labeled choice, not a hidden behavior.
-
Reference lines — horizontal markers at -100, your overbought level, zero, your oversold level, and +100. The overbought and oversold thresholds are adjustable. They mark zones of interest on the bounded scale, not reversal triggers.
How to use
-
Add the indicator to a chart. A lower timeframe works well for initial verification — something like a 1-minute or 5-minute chart — since the default slot timeframes are 5m, 15m, and 60m.
-
Check the defaults. Out of the box, three slots are enabled: Slot 01 at 5 minutes, Slot 02 at 15 minutes, Slot 03 at 60 minutes. Each uses a 20-length EMA baseline, 3-length EMA slow smoothing, equal blend weights of 33.3, ATR length 14, ATR Sensitivity 1.0, and On Bar Close enabled.
-
Confirm the output is bounded. All lines should stay within -100 and +100. If you see values outside that range, something is misconfigured.
-
Test the repaint switch. Toggle On Bar Close off and watch the slot values update with each tick as the higher-timeframe bar builds. Toggle it back on and confirm the values freeze to the last completed bar. This is the fastest way to understand what the switch actually controls.
-
Verify slot independence. The three slot lines should move at different speeds and respond to their respective timeframes. The higher-timeframe slots update less frequently — that is expected, not broken.
-
Adjust to your workflow. Disable slots you do not need. Change timeframes to match the ones you actually trade. Set blend weights to reflect which timeframe matters most to your read. The defaults are a starting point, not a recommendation.
Settings
Per-slot settings (repeated for MA 01, MA 02, MA 03)
Enable — turns the slot on or off. A disabled slot does not plot, does not blend, and does not fire alerts. If you are only using two timeframes, disable the third rather than leaving it on with default values you are not watching.
Hide Plot — hides the slot's line from the chart, but the slot still contributes to the blend and fires alerts. Use this when you want a slot's weight in the composite without the visual clutter. Easy to forget a hidden slot is still shaping the blend — check your configuration if the composite reads differently than you expect.
Source — the price series measured against the slot's MA. Default is close. Switching to hlc3 or ohlc4 smooths the input. Switching to high or low measures distance from range edges instead of settlement. Different sources produce different regime reads from the same market — this is expected, not a bug.
Timeframe — the higher timeframe whose price and ATR data the slot uses. Must be equal to or greater than your chart timeframe. The script throws a runtime error if you set it lower — that is an intentional safety check, not a limitation.
Length — lookback period for the baseline MA. Shorter lengths react faster to price changes. Longer lengths provide structural smoothing. Very short lengths on slow MA types like SMA can produce noisy readings.
MA Type — the moving average algorithm for the baseline. Each type has a different response profile. If you select ALMA, review the global ALMA Offset and Sigma parameters — they apply to every ALMA selection across all slots.
Slow Length — smoothing applied to the Fast line to produce the Slow line. Higher values slow down regime transitions. Lower values make the regime flip faster but introduce more whipsaw. Default is 3.
Slow Type — the MA algorithm used for Slow smoothing. Same considerations as the baseline MA Type.
Blend Weight — this slot's relative influence on the blended composite. Weights auto-normalize across all enabled slots, so the absolute numbers do not matter — only the ratios. Setting a slot's weight to 0 is a deliberate option: the slot still plots and fires its own alerts, but it contributes nothing to the blend.
A note on blend weight misuse: the auto-normalization means the blend always produces a number. Whether that number means anything depends entirely on whether the combination of slots is analytically coherent. Three random tickers blended equally will generate a reading that is mathematically valid and practically empty. Weight toward the timeframe or instrument that actually matters to your decision-making.
Optional Ticker — overrides the chart symbol for this slot. Leave it empty to use the chart's instrument. Useful for cross-market reads — watching one instrument's trend proximity while charting another. Choose symbols with reliable volume and meaningful ATR. A delisted or thinly-traded ticker will degrade the normalization.
Line Width — visual thickness of the slot's plot. Preference only.
Global settings
ATR Length — lookback for the ATR that normalizes price-to-MA distance. Default is 14. Shorter values make the normalization more reactive to recent volatility. Longer values stabilize it. Very short ATR lengths amplify noise in the normalized reading.
ATR Sensitivity — this is the setting that most changes how the oscillator feels, and it deserves a careful read.
ATR Sensitivity controls how quickly the oscillator approaches ±100 as price moves away from its MA. Technically, it is a multiplier applied to the ATR-normalized distance before the saturation curve compresses it. In practice:
- Higher values (e.g., 1.5–2.0) cause moderate price moves to push the oscillator toward the extremes faster. The output uses the full -100/+100 range more aggressively, but the readable middle zone shrinks. On a calm instrument, this can be useful. On a volatile one, you may find the oscillator spending most of its time near the boundaries with little differentiation between "extended" and "very extended."
- Lower values (e.g., 0.3–0.7) keep the oscillator in the midrange longer, even during trending moves. The output spreads across the center of the range, giving you more granularity between moderate readings, but extreme moves may not register as visually distinct from strong ones.
The default of 1.0 is a reasonable starting point for many instruments. Adjust it until the oscillator uses enough of the -100/+100 range to be readable during the kind of moves your instrument typically makes, without pegging at the extremes during normal trends.
Overbought Level — upper reference line and alert threshold. Default is 70. This marks a zone of interest on the bounded scale, not a reversal boundary. Setting it to 100 duplicates the hard boundary line and only triggers the overbought alert at full saturation — usually not what you want.
Oversold Level — lower reference line and alert threshold. Default is -70. Same logic as overbought.
Plot Blended Fast/Slow — whether the composite lines and fill are drawn. Turn this off when you only want individual slot reads.
Blended Line Width — visual thickness of blended Fast and Slow. Preference only.
Enable Master Smoothing — applies a final MA pass to blended Fast and Slow after the weighted composite is calculated. Default is off. Useful when the blended output is jumpier than you need. The tradeoff: smoothing on top of already-smoothed slots compounds lag. If the blended output seems sluggish with master smoothing on, this is probably why.
Master MA Type — the MA algorithm for master smoothing. Same considerations as other MA type selections.
Master Length — lookback for master smoothing. Default is 3. Increase for a calmer composite.
On Bar Close — the repaint switch, and it matters enough to understand clearly.
When enabled (the default), each slot's output reflects the last fully confirmed higher-timeframe bar. Historical readings are stable.
When disabled, the output uses the current building higher-timeframe bar. It updates in real time as new intrabar data arrives. This is useful for watching live conditions, but those values will shift until the higher-timeframe bar closes. This is repainting — intentionally, visibly, and under your control.
The verification is the same as in the setup steps above: toggle it on a live chart and watch the difference between confirmed and building-bar values.
ALMA Offset / ALMA Sigma / ALMA Floor Offset — these global parameters apply when ALMA is selected as an MA type anywhere in the configuration (baseline or slow smoothing, any slot). If no ALMA is selected, changing these has no effect. The defaults (0.85 offset, 6.0 sigma, floor offset off) match standard ALMA behavior.
Alerts
The indicator provides 18 alert conditions. Every alert fires only on confirmed chart bars. If On Bar Close is off, that still does not mean the higher-timeframe input behind the alert was confirmed.
Per-slot alerts (3 per slot, 9 total)
| Alert | Fires when |
|---|---|
| MA Osc 01/02/03 Is Bullish | The slot is enabled, Fast is above Slow, and the bar is confirmed |
| MA Osc 01/02/03 Is Bearish | The slot is enabled, Fast is below Slow, and the bar is confirmed |
| MA Osc 01/02/03 Regime Flip | The slot is enabled, the bullish/bearish state changed on this bar, and the bar is confirmed |
Blended alerts (7 total)
| Alert | Fires when |
|---|---|
| Blended MA Osc Is Bullish | Blended Fast is above blended Slow, bar confirmed |
| Blended MA Osc Is Bearish | Blended Fast is below blended Slow, bar confirmed |
| Blended MA Osc Regime Flip | The blended bullish/bearish state changed on this bar, bar confirmed |
| Blended MA Osc Crossed Above Zero | Blended Fast crossed above the zero line, bar confirmed |
| Blended MA Osc Crossed Below Zero | Blended Fast crossed below the zero line, bar confirmed |
| Blended MA Osc Overbought | Blended Fast crossed above the Overbought level, bar confirmed |
| Blended MA Osc Oversold | Blended Fast crossed below the Oversold level, bar confirmed |
Alignment alerts (2 total)
| Alert | Fires when |
|---|---|
| All MA Osc Slots Bullish | Every enabled slot has Fast above Slow simultaneously, bar confirmed |
| All MA Osc Slots Bearish | Every enabled slot has Fast below Slow simultaneously, bar confirmed |
A note on alert behavior: The bullish and bearish regime alerts fire on every confirmed bar where the condition holds, not only on the bar where the state changed. The Regime Flip alerts fire only on the transition bar itself. For most setups, configure the TradingView alert with "Once Per Bar Close" frequency to avoid redundant notifications from the regime-state alerts.
For the geeks
Most oscillators produce an unbounded reading that drifts with the price level of the instrument. Plot raw price-minus-MA distance on SPY and then on BTC and the two outputs are not even in the same universe. This oscillator handles that problem with a specific normalization pipeline, and understanding that pipeline is the key to reading the output correctly.
Step 1 — distance in ATR units. The oscillator measures the gap between price and the slot's baseline MA, then divides that gap by the current ATR value. The result is a unitless ratio: how many ATR's wide is the price-to-MA distance right now? This is what makes readings from different instruments and timeframes comparable. A reading of 1.5 means price is 1.5 ATR away from the MA, whether the instrument is a forex pair, an equity, or a crypto token.
Step 2 — saturation through a hyperbolic tangent curve. That ATR ratio is then passed through a tanh function, which maps any real number smoothly onto the range between -1 and +1 (scaled to -100/+100 for display). The key property of tanh is its S-shape: small inputs produce near-proportional outputs, but as the input grows, the output curves toward the boundary and flattens. The practical effect is that the oscillator is responsive in the middle of the range and progressively less responsive at the extremes.
This is a deliberate tradeoff. A linear oscillator would be easier to read in the middle but would blow out to +300 or -500 during strong moves, breaking the chart scale and making cross-slot comparison impossible. The tanh curve sacrifices resolution at the extremes in exchange for guaranteed boundedness. The cost is that the difference between "extended" and "very extended" is visually compressed. That is why you watch the trend of the reading near the extremes, not just the level.
What ATR Sensitivity does to the curve. ATR Sensitivity is a multiplier applied to the ATR ratio before it enters the tanh function. Raising it effectively stretches the input scale, so moderate distances push the output closer to the extremes. Lowering it compresses the input scale, keeping the output in the midrange. It is the zoom knob on the saturation curve.
Verifying this yourself. Set ATR Sensitivity to something low — 0.3 or so — and watch the oscillator stay near the center even during trending moves. Raise it to 2.0 and watch moderate moves push the reading toward ±100. Compare a slot on the chart ticker with a slot on a different ticker and confirm both stay within the same bounds. The behavior should be visible immediately.
FAQ
Does this indicator repaint?
With On Bar Close enabled (the default), no. The output uses the last confirmed higher-timeframe bar. Historical values are stable.
With On Bar Close disabled, yes — by design. The output reflects the current building higher-timeframe bar, and historical lower-timeframe bars inside that HTF interval are later backfilled with the finalized value. Toggle it on a live chart to see the difference directly.
What does the oscillator actually measure?
It measures how far price is from its moving average, expressed in ATR units and compressed through a saturation curve to stay within -100 and +100. It is an ATR-normalized distance reading, not a momentum gauge or a signal generator. The "For the geeks" section above covers the mechanics of the normalization in detail.
Do extreme values mean a reversal is coming?
No. An oscillator reading near +100 or -100 means price is far from its MA in volatility-adjusted terms. That condition can persist for a long time during strong trends. The oscillator measures how extended the move is, not whether or when it will reverse. Treat extreme readings as information about the current state, not a forecast.
Can I compare or blend readings from different tickers?
You can, and the normalization is designed to support it. Because the distance is measured in ATR units before being compressed, readings from different instruments share the same scale. A reading of +60 on one ticker and +60 on another means roughly the same degree of extension relative to each instrument's own volatility.
That said, "comparable on the same scale" and "meaningful to blend" are different questions. Blending SPY with ES because they track the same market is a coherent choice. Blending SPY with gold with a random microcap because you ran out of ideas is not. The blend will always produce a number. Whether that number informs a decision is up to you.
What does ATR Sensitivity control?
It scales the distance reading before the saturation curve compresses it. Higher values make the oscillator reach toward ±100 faster, which is useful on instruments with small moves relative to ATR. Lower values keep the output in the center of the range, which gives you more room to distinguish between moderate readings on volatile instruments. Adjust it until the oscillator uses enough of the range to be informative during normal trading conditions without living at the extremes.
Limitations
-
This oscillator does not predict reversals. Readings near ±100 mean price is far from its MA in volatility-adjusted terms. Strong trends can hold the oscillator at extreme levels for extended periods. Treating the boundaries as reversal zones is a misread, not a feature the indicator failed to deliver.
-
The normalization is context-dependent. Because the distance is divided by ATR, the same underlying price-to-MA gap can produce different oscillator values under different volatility conditions. A reading of +50 during a calm session and +50 during a volatile one represent different raw distances. The oscillator tells you how extended price is relative to current volatility, not in absolute terms.
-
Resolution diminishes at the extremes. The saturation curve that keeps the output bounded also compresses it near ±100. Moves that would register as large differences in the middle of the range produce small visual changes near the boundaries. When the oscillator is at the extremes, watch its trend and speed, not just the level.
-
Slot timeframe must be equal to or greater than the chart timeframe. The script enforces this at runtime. Setting a slot to a lower timeframe than the chart will produce an error, not a silent failure.
-
Thin or erratic markets degrade the reading. ATR normalization assumes meaningful volatility data. On instruments with very low volume, irregular trading hours, or erratic price behavior, the ATR may not represent typical volatility well, and the normalized reading becomes less reliable.
-
The blend is only as coherent as your slot choices. Auto-normalized weights mean the composite always produces a value. Whether that value reflects anything useful depends on whether the combination of timeframes and tickers serves a real analytical purpose in your process.
Support and training
Documentation, training, and support destinations should be confirmed in the active product environment.
Disclaimer
This indicator is provided for educational and informational purposes. It does not constitute financial advice, and its output should not be treated as a recommendation to buy, sell, or hold any financial instrument. Past behavior of any indicator does not guarantee future results. Trading involves risk, including the possibility of loss exceeding your initial investment. You are solely responsible for your own trading decisions. Use this tool as one input among many in a process you understand and control.
Free access
Read everything on this page first. Open it on TradingView only when you are clear on what it does and what it does not do.
Open in TradingViewRelated products
If this one is close but not quite right, there may be a better fit nearby for the same kind of chart work, testing need, or workflow gap.
Keep looking
If this one is close but not quite right, there may be a better fit nearby for the same kind of chart work, testing need, or workflow gap.
Find your starting pointWeighing a few options against each other?
Tell us what you are trying to accomplish and we will help you narrow it down honestly.