indicator | Oscillators / Moving Averages / Trend Proximity
Axiom MA Osc Pro
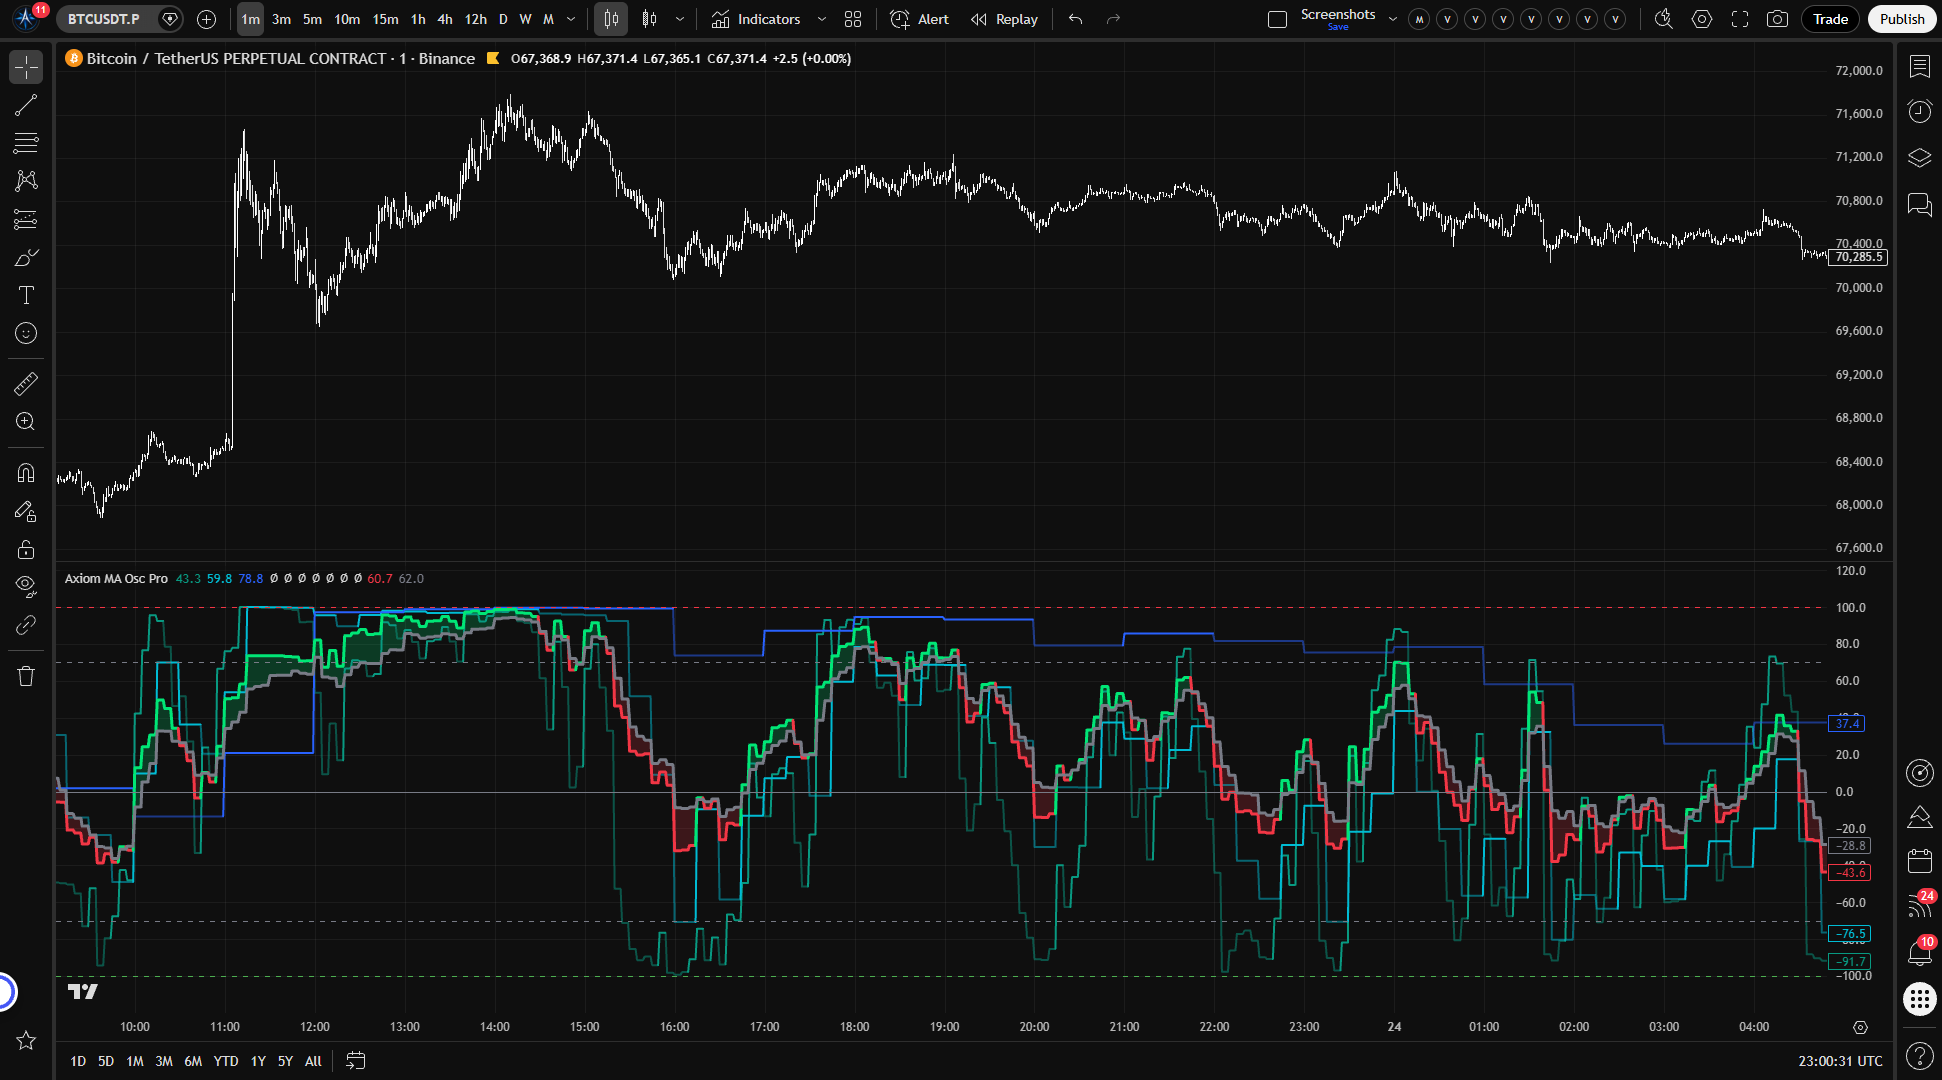
Axiom MA Osc Pro turns up to ten moving-average distance measurements into one bounded oscillator workspace, with per-slot timeframe, ticker, and smoothing control. It is built for traders who want cross-timeframe stretch context in one honest pane, not a signal generator pretending distance is direction.
Last updated: Apr 4, 2026
Crypto / Futures / Stocks / Forex / Indices | 1m / 5m / 15m / 1H / 4H / 1D
Best-fit markets
Primary timeframes
Product details
Explore the details to see whether the tool fits the problem you are trying to solve for.
Axiom MA Osc Pro
Overview
How far is price from its moving average? On one chart, one timeframe, that takes a glance. The harder version — how far is price from its average across the five or eight timeframes I actually watch, and can I line those readings up next to each other? — is where things start falling apart. Raw price-to-MA distances live in whatever units the instrument trades in. A 20-point gap on one chart and a half-point gap on another are not comparable, even if they represent the same kind of stretch relative to recent conditions. You end up stacking indicator instances, toggling between charts, or doing rough conversions in your head.
Axiom MA Osc Pro takes up to ten independent moving-average setups — each with its own timeframe, ticker, MA type, and length — and turns every one into a bounded oscillator reading between -100 and +100. Each slot takes the gap between price and its baseline MA, scales it against current ATR, and runs the result through a saturation curve so the output stays bounded no matter how far price extends. Because every reading comes out unitless and on the same scale, you can compare slots across timeframes, across instruments, or both — in one pane, on one axis.
Each of the ten slots carries its own timeframe, ticker override, price source, MA type, lookback length, smoothing configuration, blend weight, and repaint control. Enabled slots can be combined into a single weighted composite for traders who want a summary reading alongside the individual lines. This is a wide configuration surface built for people who already know which MAs they want on which timeframes and need room to set that up properly. It does not generate trade signals or score market conditions. It measures distance. What you do with that measurement is your call.
If three MA-oscillator slots handle your process, the Lite variant covers that with a simpler settings footprint. If you need a single-timeframe oscillator or something that tells you when to enter and exit, this is not the right tool. Pro adds slot capacity and per-slot configuration depth for traders who need it — it is wider, not smarter.
The normalization method behind the bounded output is nonstandard. If you want to understand how the saturation curve works, why it behaves the way it does near the extremes, and how to verify the behavior yourself, the "For the geeks" section below covers it.
Features
Up to ten independent oscillator slots Each slot operates as its own measurement unit with a configurable timeframe, price source, MA type, lookback length, slow-line smoothing, blend weight, line width, and an optional ticker override. Enable what you need — three slots are on by default, seven more are available when your process calls for them.
Per-slot Fast line with internal Slow logic Every enabled slot plots one Fast line. Fast is the ATR-normalized distance between price and the slot's baseline MA, bounded to the -100/+100 range. Slow is still calculated for each slot, but it is used internally for regime state, color, alerts, and blending rather than as a second per-slot plot. When Fast sits above Slow, the slot uses its bullish color; when below, its bearish color.
Blended composite with fill Enabled slots can feed into a single weighted Fast/Slow pair. Weights auto-normalize — set them as relative proportions (50/30/20 or whatever reflects your view) without worrying about whether they add up to 100. A shaded fill between blended Fast and blended Slow marks the current direction and the spread between the fast and smoothed readings.
Reference lines Fixed boundaries at +100 and -100 mark the mathematical limits. Configurable overbought (default +70) and oversold (default -70) levels let you set your own threshold references. A zero line marks neutral — where price sits near its MA. These are orientation markers, not action triggers.
Per-slot ticker override Any slot can track a different instrument than the chart symbol. Monitor an index alongside a single name, or run correlated pairs side by side — all producing comparable readings in the same pane because the ATR normalization removes the price-scale dependency.
Per-slot repaint control Each slot has its own "On Bar Close?" switch. When enabled (default), the slot pulls the last confirmed higher-timeframe bar values and does not update until the next HTF bar closes — no repainting. When disabled, the slot updates within the higher-timeframe bar for faster responsiveness, but the reading can shift until that bar finalizes. You choose this per slot, and you can verify the difference on a live chart in seconds.
Full MA type selection via the Axiom Moving Average Library Pro Each slot's baseline and slow-line MA can be set independently to EMA, SMA, ALMA, KAMA, FRAMA, Jurik, Laguerre, VAMA, and more. When you select an advanced type, per-slot Power User parameters — ALMA offset and sigma, Jurik phase and power, KAMA/FRAMA adaptive lengths, Laguerre alpha, VAMA volume length — become relevant and adjustable.
Optional master smoothing A final MA smoothing pass applied to both blended Fast and blended Slow after all slot-level blending. Useful when the composite output is noisier than you want and you would rather not reconfigure individual slots. It adds lag to the final reading — enable it deliberately and understand the tradeoff.
39 alert conditions Three per slot (bullish regime, bearish regime, regime flip), seven for the blended composite (regime states, zero-line crosses, overbought/oversold crosses), and two alignment alerts (all enabled slots bullish, all enabled slots bearish). Every alert fires only on confirmed bars, regardless of per-slot repaint settings.
How to use
- Add the indicator to your chart. It appears as a separate pane below price.
- Three slots are enabled by default — MA 01 at 5 minutes, MA 02 at 15 minutes, MA 03 at 60 minutes. Each uses an EMA 20 baseline with EMA 3 slow smoothing, equally weighted at 33.3.
- Make sure your chart timeframe is at or below the lowest enabled slot timeframe (5 minutes by default). The script enforces this constraint — if your chart timeframe exceeds any enabled slot's timeframe, it stops with a runtime error. This is intentional, not a bug.
- Verify the output: you should see three colored oscillator lines moving within the -100 to +100 range, a blended Fast/Slow pair with shaded fill between them, and reference lines at +100, +70, 0, -70, and -100.
- To expand beyond three slots, enable MA 04 through MA 10 in settings and configure each one's timeframe, MA type, length, and blend weight to match your analysis.
If On Bar Close is enabled (the default for all slots), readings update in steps aligned with each slot's timeframe — not tick by tick. This is the non-repainting behavior. You can confirm it by watching whether a slot's reading holds steady between higher-timeframe bar closes.
Settings
Settings follow the same pattern across all ten slots. Learn the structure once and it applies everywhere. They are listed here in the order you encounter them in the TradingView input panel.
Per-slot primary settings
-
Enable (default: on for slots 1-3, off for 4-10) — Includes or excludes the slot from calculation, plotting, blending, and alerts. Enable slots when your analysis calls for more concurrent readings. Enabling all ten without a clear purpose for each one is the easiest way to build a configuration that looks detailed but tracks nothing you can explain.
-
Hide Plot (default: off) — Hides the slot's Fast line from the chart while it still contributes to the blend. Keeps the pane clean when you want a slot's weight in the composite without seeing its individual line. A hidden slot still affects the blended output — do not forget it is there.
-
Source (default: close) — The price series the slot evaluates. Change it when you have a specific reason to measure distance from hl2, hlc3, ohlc4, or another component.
-
Timeframe (default: 5 / 15 / 60 for slots 1-3; chart timeframe for 4-10) — The higher-timeframe context for the slot's MA and ATR calculation. Must be at or above the chart timeframe — setting it lower produces a runtime error.
-
Length (default: 20 for slots 1-3; 21 for 4-10) — Lookback period for the baseline MA. Match this to the MA period you already use in your methodology. Very short lengths on high timeframes can produce erratic readings.
-
Type (default: EMA for slots 1-3; SMA for 4-10) — The MA algorithm for the baseline calculation. The full Axiom MA Library Pro selection is available. If you choose an advanced type like Jurik, ALMA, or Laguerre, configure its Power User parameters too — the defaults may not suit your instrument or timeframe.
-
Slow Length (default: 3) — Lookback for the smoothed Slow line derived from Fast. Longer values widen the separation between Fast and Slow. Setting it to 1 effectively removes smoothing.
-
Slow Type (default: EMA) — The MA algorithm used to smooth Fast into Slow. Same library, same Power User parameter considerations as the baseline.
-
Line Width (default: 2) — Visual thickness of the slot's plotted Fast line. Cosmetic only.
-
Blend Weight (default: 33.3 for slots 1-3; 0 for 4-10) — The slot's relative contribution to the blended composite. Weights auto-normalize, so set them as relative proportions — no need to make them sum to 100. A weight of 0 keeps the slot's individual plot and alerts active without influencing the blend. If you leave default weights on slots that represent different timeframes or instruments, you are treating them all as equally important. Make sure that is actually your view.
-
Optional Ticker (default: empty) — Overrides the chart symbol for this slot. Useful for tracking a correlated instrument, an index, or a different asset alongside the charted one. Blending readings from unrelated instruments produces a number that is always mathematically valid but may be analytically empty. Think about whether the combination serves a real thesis before trusting the output.
Per-slot Power User settings
-
On Bar Close? (default: on) — The repaint control. When enabled, the slot returns the last confirmed higher-timeframe bar values. Readings do not update intrabar and do not repaint. When disabled, the slot updates within the higher-timeframe bar for faster responsiveness, but the reading can and will shift until that bar closes. Disable it only when you need live intrabar updates and understand what you are trading away.
-
Advanced MA parameters — ALMA Offset, ALMA Sigma, ALMA Floor Offset, KAMA/FRAMA Fast and Slow lengths, Jurik Phase and Power, Laguerre Alpha, and VAMA Volume Length. Each of these applies only when the corresponding MA type is selected for that slot's baseline calculation. An identical set exists for each slot's Slow MA (prefixed "Slow" instead of "Baseline"). If you are not using an advanced MA type, these settings have no effect.
General oscillator settings
-
ATR Length (default: 14) — Lookback period for the ATR used to normalize price-to-MA distance. Shorter values make the normalization more reactive to recent volatility swings. Longer values smooth it out. Match this to what makes sense for the instrument and the range of timeframes you are covering.
-
ATR Sensitivity (default: 1.0) — A scaling factor applied to the ATR-normalized distance before the saturation curve compresses it. Higher values make the oscillator reach its extremes more readily. Lower values keep readings closer to the midline. If the oscillator spends most of its time pinned near the boundaries, lower the sensitivity. If it barely moves away from zero, raise it. See "For the geeks" below for more on how this interacts with the saturation curve.
-
Overbought Level (default: 70) — Upper reference line and alert threshold. Adjust per instrument or trading style. This is a reference level, not a reversal trigger.
-
Oversold Level (default: -70) — Lower reference line and alert threshold. Same idea, lower side.
Display settings
- Plot Blended Fast/Slow (default: on) — Shows or hides the blended composite lines and their fill.
- Blended Line Width (default: 3) — Visual thickness of the blended Fast and Slow lines.
Master smoothing
- Enable Master Smoothing (default: off) — Applies a final MA smoothing pass to both blended Fast and blended Slow after all slot-level blending is complete. Calms a noisy composite without changing individual slot parameters. Adds lag to the final output.
- Master MA Type (default: EMA) — The MA algorithm for the master smoothing pass. Same library as slot-level MAs, same advanced-parameter considerations.
- Master Length (default: 3) — Lookback for the master smoothing. Longer values produce a smoother but more lagged composite.
Master smoothing has its own advanced-MA parameter set (ALMA, Jurik, KAMA/FRAMA, Laguerre, VAMA), relevant only when the corresponding type is selected.
Alerts
All 39 alert conditions are gated by confirmed chart bars. That keeps them from firing mid-bar on the chart timeframe, but a slot running with On Bar Close disabled can still feed live higher-timeframe values into the condition at that chart close. Set your alert frequency to "Once per bar close" for consistent chart-bar handling.
Per-slot alerts (3 per slot x 10 slots = 30 conditions)
Each enabled slot can trigger three alerts:
- Bullish — Fast is above Slow on a confirmed bar.
- Bearish — Fast is below Slow on a confirmed bar.
- Regime flip — The bullish/bearish state changed on a confirmed bar.
Alert messages include the slot number, ticker, and interval for identification.
Blended alerts (7 conditions)
- Blended Bullish / Bearish / Regime Flip — Same regime logic as per-slot alerts, applied to the blended composite.
- Crossed Above Zero / Crossed Below Zero — Blended Fast crossed the zero line on a confirmed bar.
- Crossed Above Overbought / Crossed Below Oversold — Blended Fast crossed the configured threshold level on a confirmed bar.
Alignment alerts (2 conditions)
- All Slots Bullish — Every enabled slot has Fast above Slow on a confirmed bar.
- All Slots Bearish — Every enabled slot has Fast below Slow on a confirmed bar.
For the geeks
Most oscillators that subtract a moving average from price produce readings in price-space units. Those numbers are only meaningful within the specific context where they were calculated — a 5-minute EMA distance on one instrument and a daily SMA distance on another live in completely different scales. You cannot compare them, and you certainly cannot average them into something coherent.
This oscillator handles that differently. Each slot's price-to-MA gap is divided by the current ATR, converting it from a price distance into a volatility-relative distance. After that step, the reading is unitless. A value of 2.0 means price is two ATRs from the average, whether the instrument trades at $5 or $50,000.
That ATR-normalized distance is then scaled by the ATR Sensitivity setting and passed through a hyperbolic tangent function. Tanh naturally compresses any input — no matter how extreme — into a bounded range. The result is multiplied by 100 to give you the -100 to +100 scale on the chart.
The result is a saturation curve. Near the midline, small price moves create roughly proportional oscillator moves. The reading feels responsive and direct. As it approaches the extremes, the curve flattens — equal-sized price moves produce progressively smaller oscillator changes. This is not a smoothing artifact or a side effect. It is a deliberate engineering choice. Without it, a strong trend could push the oscillator to a value where it stays parked until the trend reverses, and all the resolution that makes the reading useful would be lost. The saturation keeps the oscillator informative across its full range.
ATR Sensitivity is your lever into this curve. At lower values (try 0.5), the oscillator stays closer to the midline and rarely approaches the boundaries — useful when you want to see fine distinctions within moderate moves. At higher values (try 2.0), it reaches the extremes more easily and spends less time in the middle range. The right setting depends on the instrument, the timeframe range you are covering, and what you are trying to distinguish.
Because the output is unitless and bounded after this conversion, readings from different tickers and different timeframes share the same axis without distortion. That is what makes cross-slot comparison and weighted blending work — the normalization strips out the price-scale dependency before any aggregation happens.
Verify it yourself: Set ATR Sensitivity to 0.5, then to 2.0, on the same instrument. Watch how the oscillator redistributes its readings across the range. The saturation behavior is immediate and visible.
FAQ
Does this indicator repaint?
That depends on a per-slot setting you control. Each slot has an "On Bar Close?" switch. When it is on (the default), the slot pulls the last confirmed higher-timeframe bar values. The reading does not update mid-bar and is the stable mode. When you turn On Bar Close off, the slot uses live higher-timeframe values for more responsiveness, so the reading can shift before that higher-timeframe bar closes and the historical presentation is not something to treat like confirmed-mode evidence. All 39 alert conditions still wait for a confirmed chart bar, but if a slot is in live mode the alert can still reflect unfinished higher-timeframe data at that chart close.
What is the difference between the Pro and Lite versions?
Slot count and configuration depth. Lite has three slots and uses the Lite MA library. Pro has ten slots, each with access to the full Axiom Moving Average Library Pro and per-slot advanced MA parameters. The core math — ATR normalization followed by tanh-bounded compression — is the same in both versions. If your process works within three concurrent MA-oscillator readings, Lite does the job with a smaller settings surface. Pro exists for traders who need more room.
Do I need to configure all ten slots?
No. Three are enabled by default with sensible starting values. The remaining seven are off until you turn them on. Add slots when your analysis actually calls for them. There is no benefit to enabling slots without a clear purpose — the indicator will produce a number either way, but that number only carries meaning when the setup behind it reflects something you intended to measure.
Can I blend readings from different instruments?
Yes. Each slot has an Optional Ticker field that can point to a different symbol. Because ATR normalization makes readings from different instruments comparable on the same scale, blending them produces a valid weighted average. Whether that average tells you anything worth knowing depends entirely on whether the combination makes analytical sense. Blending ES with NQ because you are tracking index correlation is a deliberate choice. Blending gold with a biotech stock because you had empty slots is not. The math does not distinguish between the two — that is your job.
What does ATR Sensitivity actually do?
It scales the ATR-normalized distance before the saturation curve compresses it. Higher values push the oscillator toward its extremes more quickly. Lower values keep it closer to the midline. If the oscillator spends most of its time flattened against the +100 or -100 boundary, lower the sensitivity so you can see gradations within that range. If it clusters near zero and you cannot distinguish meaningful moves from noise, raise it. The "For the geeks" section above explains the underlying mechanics and includes a quick way to see the effect for yourself.
Limitations
-
The oscillator measures distance from a moving average, not the direction price is heading. An extreme reading means price has stretched far from its baseline in volatility-adjusted terms. It does not mean a reversal is imminent. Readings near +100 or -100 can persist for extended periods in trending markets.
-
ATR normalization makes every reading relative to recent volatility. If the ATR shifts materially — because the instrument enters a different volatility regime or because the ATR lookback is too short for the conditions — the oscillator's response to the same size price-to-MA gap will change along with it.
-
The blended composite is a weighted average of distance readings. It smooths disagreement between slots rather than surfacing it. If one slot carries a reading that matters and nine others dilute it, the blend will bury that information under the average. Watch individual slot lines when you need to see divergence, not consensus.
-
When On Bar Close is disabled for a slot, that slot shows intrabar updates that can change until the higher-timeframe bar closes. The chart history after the fact will look stable — the instability only existed in real time and is not visible in hindsight.
-
The script enforces that each slot's timeframe must be at or above the chart timeframe. Setting a slot to 15 minutes on a 60-minute chart produces a runtime error. There is no override. This is a deliberate safety constraint that prevents invalid higher-timeframe lookups.
-
Ten slots with full advanced-MA parameters produce a large settings surface. The tool does not tell you when your configuration is analytically incoherent. Ten slots blended without intent can produce output that looks clean and authoritative while measuring nothing the trader can account for. Configure each slot with a reason.
Support and training
Visit the AxiomCharts website for documentation, guides, and support.
Disclaimer
This indicator is provided for educational and informational purposes only. It is not financial advice, a trading recommendation, or an invitation to buy or sell any financial instrument. Past performance of any trading tool or methodology does not indicate future results. Trading carries substantial risk of loss and is not appropriate for every investor. You are solely responsible for your own trading decisions. Do your own research and consider consulting a qualified financial advisor before committing capital.
Related products
If this one is close but not quite right, there may be a better fit nearby for the same kind of chart work, testing need, or workflow gap.
Keep looking
If this one is close but not quite right, there may be a better fit nearby for the same kind of chart work, testing need, or workflow gap.
Find your starting pointWeighing a few options against each other?
Tell us what you are trying to accomplish and we will help you narrow it down honestly.