indicator | Trend Analysis / Moving Averages / Multi-Timeframe
Axiom MA Pro
Axiom MA Pro gives you up to ten moving-average slots, per-slot repaint control, weighted blending, and bar-close-gated alerts in one overlay. It is built for traders who use higher-timeframe MA alignment as real process and want room to configure it properly without lying to themselves about the data.
Last updated: Apr 4, 2026
Crypto / Futures / Stocks / Forex / Indices | 1m / 5m / 15m / 1H / 4H / 1D
Best-fit markets
Primary timeframes
Product details
Explore the details to see whether the tool fits the problem you are trying to solve for.
Axiom MA Pro
Overview
If you've stacked moving averages across timeframes before, you already know the problem. You set up a 5-minute MA, a 15-minute MA, maybe an hourly one. They all agree, so you feel good about your directional read. Then you realize the higher-timeframe overlays were updating with data from bars that hadn't closed yet. The alignment you trusted on history wasn't what you would have seen in real time. Your bias check was running on a draft, not a final.
Axiom MA Pro is a multi-timeframe moving average overlay with up to ten independent slots. Each slot runs its own MA type, length, timeframe, and source — and each one has its own repaint control. By default, every slot uses confirmed higher-timeframe bars only, so historical values match what you would have seen in real time. If you want faster updates from a still-forming bar, you turn that off per slot, knowingly.
It also blends enabled slots into a single weighted line that summarizes your stack's directional consensus, and provides 35 alert conditions — all gated by bar close.
This tool is for traders who already use moving averages for directional bias and work across two or more timeframes. It consolidates what would otherwise require multiple separate MA indicators into one configurable overlay with honest data handling.
This tool is not for beginners looking for a single "best MA" setup, or anyone expecting buy/sell signals. Axiom MA Pro provides bias context. It does not generate entries, exits, or trade decisions.
Why this matters
A single-timeframe MA can agree with your bias by coincidence. Stacking across timeframes is how you pressure-test that read — but only if every layer is reporting from closed bars. When it isn't, the check flatters your view, and you won't know until a live position shows you. The real damage is downstream: if your chart history doesn't match what you lived through, every review you run afterward is learning from fiction. The value here isn't more lines on a chart. It's that the lines you keep are backed by finalized data, and any exception to that is a decision you made deliberately.
Features
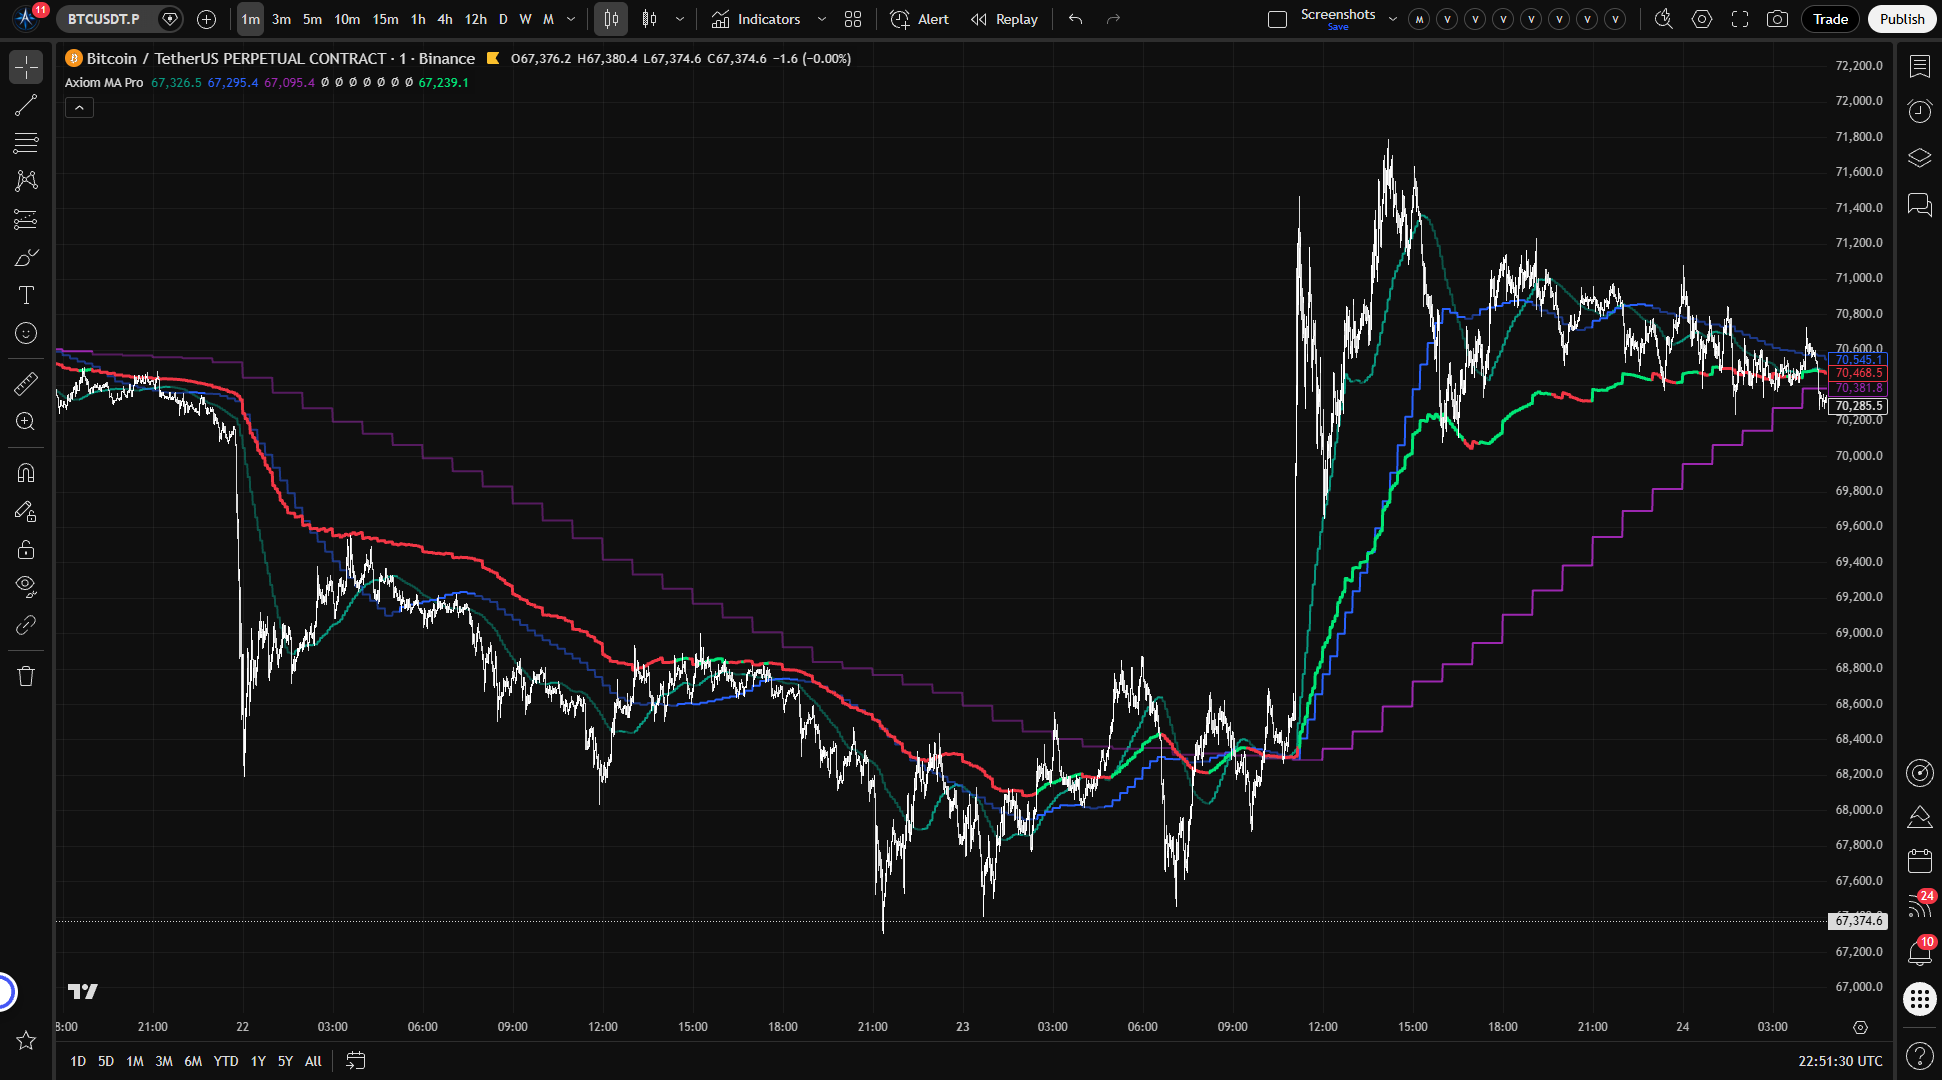
Individual MA lines (up to 10) Each enabled slot draws a moving average line on the chart. The line changes color based on the slot's trend state — if the MA is at or above where it was N bars ago (using the slot's own timeframe and trend length), it plots in the up-trend color. Otherwise, it plots in the down-trend color. Each slot is independently configurable: different MA type, length, timeframe, source, and even a different ticker.
Blended MA line When enabled, the blend draws a single line that represents the normalized weighted average of all contributing slots. This is not a moving average of moving averages — it's a weighted snapshot of where each slot's MA currently sits, combined according to the weights you assign. The blend's trend color reflects a weighted vote: if the combined weight of uptrend slots meets or exceeds the combined weight of downtrend slots, the blend reads uptrend.
Hidden diagnostic plots Two values — Active Uptrend Count and Active Downtrend Count — are calculated but not drawn on the chart. They're available as placeholders in alert message templates, so you can include a numeric bias count in webhook or mobile notifications without cluttering the visual.
A note on hidden slots: Hiding a slot's plot removes it from the chart visually, but the slot still computes and still contributes to the blended MA and alert counts. Hidden does not mean disabled.
How to use
-
Add the indicator to a chart. The default configuration enables three slots: MA 01 on the 5-minute timeframe, MA 02 on 15-minute, and MA 03 on 60-minute. All three use SMA with a length of 20, On Bar Close enabled, and equal blend weights (33.3% each). The blended MA is on.
-
Check your chart timeframe. Your chart must be at or below 5 minutes — the lowest default slot timeframe. If the chart timeframe is higher than any slot's configured timeframe, you'll get a runtime error.
-
Read the chart. You should see three MA lines (colored by trend state) plus one blended line. If all lines share the same trend color, your stack agrees on direction. If they disagree, the stack is mixed — which is itself useful information.
-
Customize from there. Change MA types, lengths, timeframes, or sources on any slot. Enable additional slots (04–10) as needed. Adjust blend weights to give more influence to the timeframe layers you consider most important.
What correct first use looks like: On a 1-minute or 5-minute chart, three smoothed lines at different levels — because they pull from different timeframe data — plus one blended summary line. Colors shift as each layer's trend state changes. No lines should be updating erratically mid-bar if On Bar Close is enabled. They update when their higher-timeframe bar closes.
Settings
Per-slot settings
Each of the 10 slots has its own copy of these settings. Slots 01–03 are enabled by default; 04–10 are off.
| Setting | Default | What it does | When to change it | Watch out for |
|---|---|---|---|---|
| Enable | 01–03: on, 04–10: off | Turns the slot on or off entirely. | When adding or removing a timeframe layer. | Enabling all ten without understanding what each adds. More lines doesn't mean more clarity. |
| Hide Plot | off | Hides the line from the chart. The slot still computes and contributes to the blend and alerts. | When you want a slot to influence the blend or alerts without drawing on the chart. | Forgetting that a hidden slot is still active. |
| Source | close | Which price series the MA evaluates. | When you want to base a layer on a different price component (open, hl2, hlc3, etc.). | Changing the source shifts both the MA's level and its timing characteristics. |
| Timeframe | 01: 5m, 02: 15m, 03: 60m, 04–10: chart | The timeframe from which the MA pulls data. Must be at or above the chart timeframe. | Set each slot to the timeframe layer you want it to represent. Leave blank for the chart's own timeframe. | Setting a slot below the chart timeframe causes a runtime error. |
| Length | 20 | Lookback period for the MA calculation. | Adjust to match your preferred MA length for that timeframe layer. | Very short lengths on high timeframes produce noise. Very long lengths on low timeframes produce heavy lag. |
| MA Type | SMA | Which moving average algorithm to use. The Axiom MA Library supports SMA, EMA, ALMA, KAMA, FRAMA, Jurik, Laguerre, VAMA, and others. | When you want a specific smoothing behavior on a particular layer. | Advanced types (ALMA, Jurik, KAMA) have additional parameters that need separate configuration — see power-user settings below. |
| Trend Length | 01–03: 3, 04–10: 2 | How many bars back (in the slot's timeframe) to compare the MA to itself for trend detection. | Increase for slower trend changes, decrease for faster. Avoid 0 unless you explicitly want that slot to read as downtrend once it has a value; the current script does not expose a neutral trend state. | Too low on high timeframes means the trend flips on every minor pullback. |
| Blended Weight | 01–03: 33.3, 04–10: 0 | The slot's relative influence in the blended MA. Weights are normalized at runtime. | Increase for timeframe layers you consider more important to directional bias. Set to 0 to exclude from the blend while keeping the slot active on its own. | Extreme weight on one slot effectively turns the blend into a copy of that slot. The script also does not clamp weights to a 0–100 range, so negative values can produce counterintuitive blend behavior. |
| Line Width | 2 (slots), 3 (blend) | Visual thickness of the MA line. | Aesthetic preference. | — |
On Bar Close — the repaint control
This is the most important setting in the indicator. It appears per slot as "On Bar Close?" and defaults to on.
- On (default): The slot uses the last confirmed higher-timeframe bar — the one that's fully closed and finalized. What you see on history is what you would have seen live. This is the mode to use for backtesting, visual analysis, and any work where historical accuracy matters.
- Off: The slot uses the current higher-timeframe bar, which is still forming. The MA updates more frequently, but it repaints — historical values show the final bar data, not the intermediate values you would have seen as the bar was building. Backtests run with this off are unreliable.
You can verify the difference yourself: add the indicator to a 1-minute chart, enable one slot on a 15-minute timeframe with On Bar Close on. Watch it — the MA updates only when the 15-minute bar closes, and old values don't change. Now turn On Bar Close off on that slot. The MA updates every chart bar and may visibly shift as the higher-timeframe candle builds.
Optional ticker — cross-asset overlay
Each slot has an "Optional Ticker" field. When set, the slot pulls its MA from a different symbol's price data and, when the ratio can be computed, scales it into the chart's price region using a close-price ratio.
This is useful for directional comparison — for example, overlaying an S&P 500 MA on a single stock chart to see whether the stock's directional bias aligns with the index. But the scaling is an approximation. The ratio between the two symbols moves over time, so the projected MA drifts relative to what a raw overlay would show. Use it for directional context, not for precise level analysis or relative-value measurement.
Power-user parameters
These apply only when the corresponding MA type is selected on a slot. If you're running SMA or EMA, you can skip this section entirely.
| Setting | Default | Applies to | What it controls |
|---|---|---|---|
| ALMA Offset | 0.85 | ALMA | Gaussian bell position. Higher values emphasize recent data. |
| ALMA Sigma | 6.0 | ALMA | Gaussian bell width. Lower values produce a tighter, more responsive curve. |
| ALMA Floor Offset? | off | ALMA | Floors the offset to the nearest integer. |
| KAMA/FRAMA Fast | 2 | KAMA, FRAMA | Fast-period constant for adaptive smoothing. |
| KAMA/FRAMA Slow | 30 | KAMA, FRAMA | Slow-period constant for adaptive smoothing. |
| Jurik Phase | 0 | Jurik | Phase shift of the Jurik filter. |
| Jurik Power | 2.0 | Jurik | Smoothing aggressiveness. |
| Laguerre Alpha | 0.5 | Laguerre | Damping factor. Lower = smoother and more lagged. |
| VAMA Vol Length | 20 | VAMA | Lookback for the volatility-adjusted component. |
Alerts
Axiom MA Pro provides 35 alert conditions, all gated by chart-bar close. Alerts fire only after the current chart bar closes, which cuts intrabar noise.
Per-slot alerts (3 per slot × 10 slots = 30)
| Alert | Type | What it means |
|---|---|---|
| MA XX Is Uptrend | Continuous | Fires on every confirmed chart bar where the slot reads uptrend. |
| MA XX Is Downtrend | Continuous | Fires on every confirmed chart bar where the slot reads downtrend. |
| MA XX Trend Change | Edge-triggered | Fires once when the slot's trend flips direction on a confirmed chart bar. |
Blended MA alerts (3)
| Alert | Type | What it means |
|---|---|---|
| Blended MA Is Uptrend | Continuous | Fires on every confirmed chart bar where the weighted trend vote reads uptrend. |
| Blended MA Is Downtrend | Continuous | Fires on every confirmed chart bar where the weighted trend vote reads downtrend. |
| Blended MA Trend Change | Edge-triggered | Fires once when the weighted trend vote flips. |
Global alignment alerts (2)
| Alert | Type | What it means |
|---|---|---|
| All MA Slots Uptrend | Continuous | Fires when every enabled slot with a valid value reads uptrend on a confirmed chart bar. |
| All MA Slots Downtrend | Continuous | Fires when every enabled slot with a valid value reads downtrend on a confirmed chart bar. |
Alert message placeholders: The hidden plots Active Uptrend Count and Active Downtrend Count can be referenced in the TradingView Create Alert dialog message template for quick numeric triage via webhook or mobile notification.
Important caveat: The bar-close gate operates on the chart timeframe, not the slot's higher timeframe. If On Bar Close is off on a slot, that slot's data can still shift mid-higher-timeframe-bar even though the alert waits for the chart bar to close. The alert fires on confirmed chart bars, but the data behind it may not yet be final if the higher-timeframe bar is still forming.
For the geeks
Three things under the hood work differently than you might assume. None of these are bugs — they're deliberate choices with specific tradeoffs.
Confirmed-bar HTF requests When On Bar Close is enabled, each slot requests the previous higher-timeframe bar — the one that already closed — rather than the current one. This is what makes the historical view match what you would have actually seen: the value can't change because the bar it came from is already finalized. The tradeoff is one bar of lag on the higher timeframe. On a 1-minute chart with a 60-minute slot, the MA updates once per hour when the hourly bar closes, not every minute. That lag is the cost of honest data.
Cross-asset scaling When a slot pulls data from a different ticker, the indicator computes a ratio between the chart symbol's price and the alternate ticker's price, then multiplies the alternate MA by that ratio to project it into the chart's price region. The result tracks the alternate ticker's general direction, plotted near the chart symbol's price level. It is not an exact overlay — the ratio itself shifts over time, so the scaled value drifts. Think of it as a directional reference, not a level you'd draw support at.
Blended MA and weighted trend voting The blended line is a normalized weighted average of current slot values — not a moving average applied on top of other moving averages. Each slot contributes its MA value multiplied by its assigned weight, and the total is divided by the sum of active weights. This preserves the character of each individual MA rather than smoothing over it again. The blend's trend color comes from a weighted vote: the indicator sums the weights of all uptrend slots and all downtrend slots, and calls it uptrend if the up-weight meets or exceeds the down-weight. The blend reflects the combined opinion of your configured stack. It does not perform its own independent analysis.
FAQ
Does this indicator repaint? By default, no. Every slot ships with On Bar Close enabled, which means it uses only confirmed higher-timeframe bars. What you see on history is what you would have seen live. If you disable On Bar Close on any slot, that specific slot will repaint — its historical values will show the final higher-timeframe data, not the intermediate values you would have seen as the bar was forming. You can verify this yourself by toggling the setting on a low-timeframe chart and watching how the MA line updates.
What happens if I set a slot timeframe lower than my chart? The indicator throws a runtime error. Each slot's timeframe must be equal to or higher than the chart timeframe. If you're on a 15-minute chart, your slots need to be set to 15 minutes or above.
How does the blended MA work — is it another moving average? No. The blend is a weighted average of current MA values from each contributing slot — not a smoothed series layered on top of other smoothed series. If slot A has a value of 100 at weight 60 and slot B has a value of 110 at weight 40, the blend is (100×60 + 110×40) / 100 = 104. Each slot keeps its own character. The blend just combines their current positions proportionally.
Can I overlay MAs from different symbols? Yes. Each slot has an Optional Ticker field. When set, the MA is computed from that symbol's data and, when the ratio can be computed, scaled into the chart's price region for visual comparison. The scaling uses a close-price ratio, which means it's an approximation. It works well for seeing whether two instruments agree on direction. It does not work as a precise relative-value or correlation measurement.
Why do my alert counts not match what I see on the chart? Most likely, you have one or more slot plots hidden. Hiding a slot removes its line from the chart, but the slot still computes and still contributes to the blend, alert counts, and alignment conditions. Check whether any hidden slots are still enabled — they're doing work you can't see.
Limitations
- Bias context, not a signal generator. This indicator helps you assess whether directional bias holds across timeframe layers. It does not tell you when to enter, exit, or size a trade. Alignment across your stack is a bias filter, not an entry condition.
- Cross-ticker scaling is approximate. The close-price ratio used to map an alternate ticker's MA into the chart's price space drifts as the ratio between the two symbols changes. Use it for directional comparison, not for precise levels, relative value, or correlation analysis.
- The blend reflects the weights you give it. Extreme weight on one slot turns the blended line into a near-copy of that slot. If your slots cover similar timeframes with correlated inputs, unanimous agreement may be less meaningful than it appears.
- Disabling On Bar Close makes historical data unreliable. With the setting off, historical values show final higher-timeframe data — not the intermediate values you would have seen live. Any backtest or historical analysis using that data will look cleaner than what actually happened in real time.
- TradingView security call limits apply. The indicator uses up to 10
request.security()calls for MA data, plus additional calls for cross-ticker scaling. This counts toward TradingView's per-script limit.
Support and training
For setup, alerts, repainting, and limitations, use the accompanying Axiom MA Pro manual pages.
Disclaimer
This indicator is an analytical tool for informational and educational purposes. It does not constitute financial advice, and nothing in its output should be interpreted as a recommendation to buy, sell, or hold any financial instrument. Trading involves risk, including the possibility of loss exceeding your initial investment. Past performance — whether observed on this indicator's chart output, in backtesting, or in any other context — does not guarantee future results. You are solely responsible for your own trading decisions. Use this tool as one input in your own analysis and risk management process.
Related products
If this one is close but not quite right, there may be a better fit nearby for the same kind of chart work, testing need, or workflow gap.
Keep looking
If this one is close but not quite right, there may be a better fit nearby for the same kind of chart work, testing need, or workflow gap.
Find your starting pointWeighing a few options against each other?
Tell us what you are trying to accomplish and we will help you narrow it down honestly.