indicator | Oscillators / MACD / Momentum
Axiom MACD Osc Lite
Axiom MACD Osc Lite runs up to three MACD slots, normalizes the MACD, signal, and histogram outputs against recent volatility, and blends them into one bounded pane. It is for traders who already use MACD and want honest cross-timeframe comparison, not a decorative crossover machine.
Last updated: Apr 4, 2026
Crypto / Futures / Stocks / Forex / Indices | 1m / 5m / 15m / 1H / 4H / 1D
Best-fit markets
Primary timeframes
Product details
Explore the details to see whether the tool fits the problem you are trying to solve for.
Axiom MACD Osc Lite
Overview
MACD convergence/divergence is one of the most widely used reads in technical analysis — and one of the hardest to compare across timeframes. Raw MACD values inherit the price level and volatility of whatever produced them. A reading of +3.50 on a 5-minute chart and +3.50 on an hourly chart look identical, but they describe entirely different market conditions. The question traders return to most — does the longer timeframe confirm or contradict what the shorter one is showing? — is one that standard MACD cannot answer cleanly. The numbers look comparable. They are not.
Axiom MACD Osc Lite runs up to three independent MACD calculations, each on its own configurable timeframe and optional ticker. Every component — the MACD line, the Signal line, and the Histogram — gets normalized into a bounded -100 to +100 range using ATR scaling and a saturation curve. The output is unitless. A reading of +60 on the 5-minute slot and +60 on the hourly slot mean the same thing: moderate convergence relative to recent volatility on that timeframe. Enabled slots blend into a single weighted composite with its own K, D, and Histogram output. Optional master smoothing can be applied after blending.
This is a convergence/divergence instrument. It helps you see how the fast-versus-slow relationship behaves across the timeframes you watch. Crossovers are readings, not instructions.
Who this fits: Someone who already uses MACD convergence/divergence as part of their workflow and wants to track it across multiple timeframes or instruments on one bounded axis. Someone who will configure slot timeframes, MA types, and blend weights to match the way they actually trade.
Who this does not fit: Someone looking for a tool where MACD crossovers generate entries automatically. Someone who wants multi-timeframe agreement treated as proof that a trade will work. Someone expecting a standard unbounded MACD.
Two things to understand before interpreting the output:
-
The saturation curve compresses large values toward ±100 asymptotically. Equal-sized increases in convergence produce progressively smaller oscillator changes near the bounds. That keeps any single trending timeframe from dominating the pane — but if you assume the scaling is linear, you will misread what extreme values mean.
-
A bullish blended regime could mean every slot turned bullish at once, or it could mean one heavily weighted slot flipped while the others were already there. The blend averages the readings. It does not tell you whether that number represents agreement or one loud voice.
Does not repaint when On Bar Close is enabled, which is the default. When On Bar Close is off, slot values update in real time as the higher-timeframe bar builds and will change until that bar closes. That is a deliberate mode, not a defect. You can verify the difference on any live chart by toggling the setting.
Why this matters
Traders compare MACD across timeframes constantly. "Is the 5-minute divergence confirmed by the hourly?" is one of the most common questions in momentum analysis — and one of the easiest places to build conviction on a comparison that does not hold up. When the values are not on the same scale, you end up eyeballing a relationship between numbers that share a label but measure at different magnitudes. Sometimes you get it right by feel. Sometimes the feel is wrong and the trade that followed it tells you so.
A bounded oscillator that puts every slot on the same axis does not make the convergence/divergence reading more predictive. What it does is remove the silent scaling mismatch that made the comparison unreliable in the first place.
Features
Per-slot K lines (up to 3) — Each slot runs its own MACD on a configurable timeframe and optional ticker, normalizes the result into a bounded -100/+100 reading. The K line is the ATR-normalized MACD value. Color shifts when K crosses D, making each slot's regime visible at a glance without checking numbers.
Blended K line — Weighted composite of all enabled slots' normalized MACD values. One line that summarizes the convergence/divergence picture across your configured timeframe or ticker stack. Weights auto-normalize — only relative proportions matter.
Blended D line — Weighted composite Signal. The relationship between blended K and blended D defines the composite regime: K above D is the bullish read, K below D is the bearish read.
K/D fill — Shaded region between blended K and blended D. Widening fill means the composite MACD is pulling away from its signal — the divergence is growing. Narrowing fill means that gap is closing.
Blended Histogram — Columns around the zero line built from the weighted average of each slot's independently normalized MACD-minus-Signal value. Positive columns mean that slot-level histogram pressure is net positive across the blend. Negative columns mean it is net negative. These zero crossings are useful context, but they are not a literal blended K-minus-D event.
Reference lines — Fixed horizontal grid at -100, the oversold level, zero, the overbought level, and +100. The OB/OS levels default to +70 / -70 and are configurable. These mark zones within the bounded range. They are not reversal thresholds.
How to use
-
Add to a chart. A 1-minute chart is a good starting point for verification — the default slot timeframes are 5-minute, 15-minute, and 60-minute, which all satisfy the requirement that each slot's timeframe be greater than or equal to the chart timeframe.
-
Review the defaults. Three slots enabled at 5m / 15m / 60m. Standard MACD lengths: 12 fast, 26 slow, 9 signal. EMA for both the MACD and Signal calculations. Equal blend weights (33.3 each). ATR length 14, ATR Sensitivity 1.0. On Bar Close enabled.
-
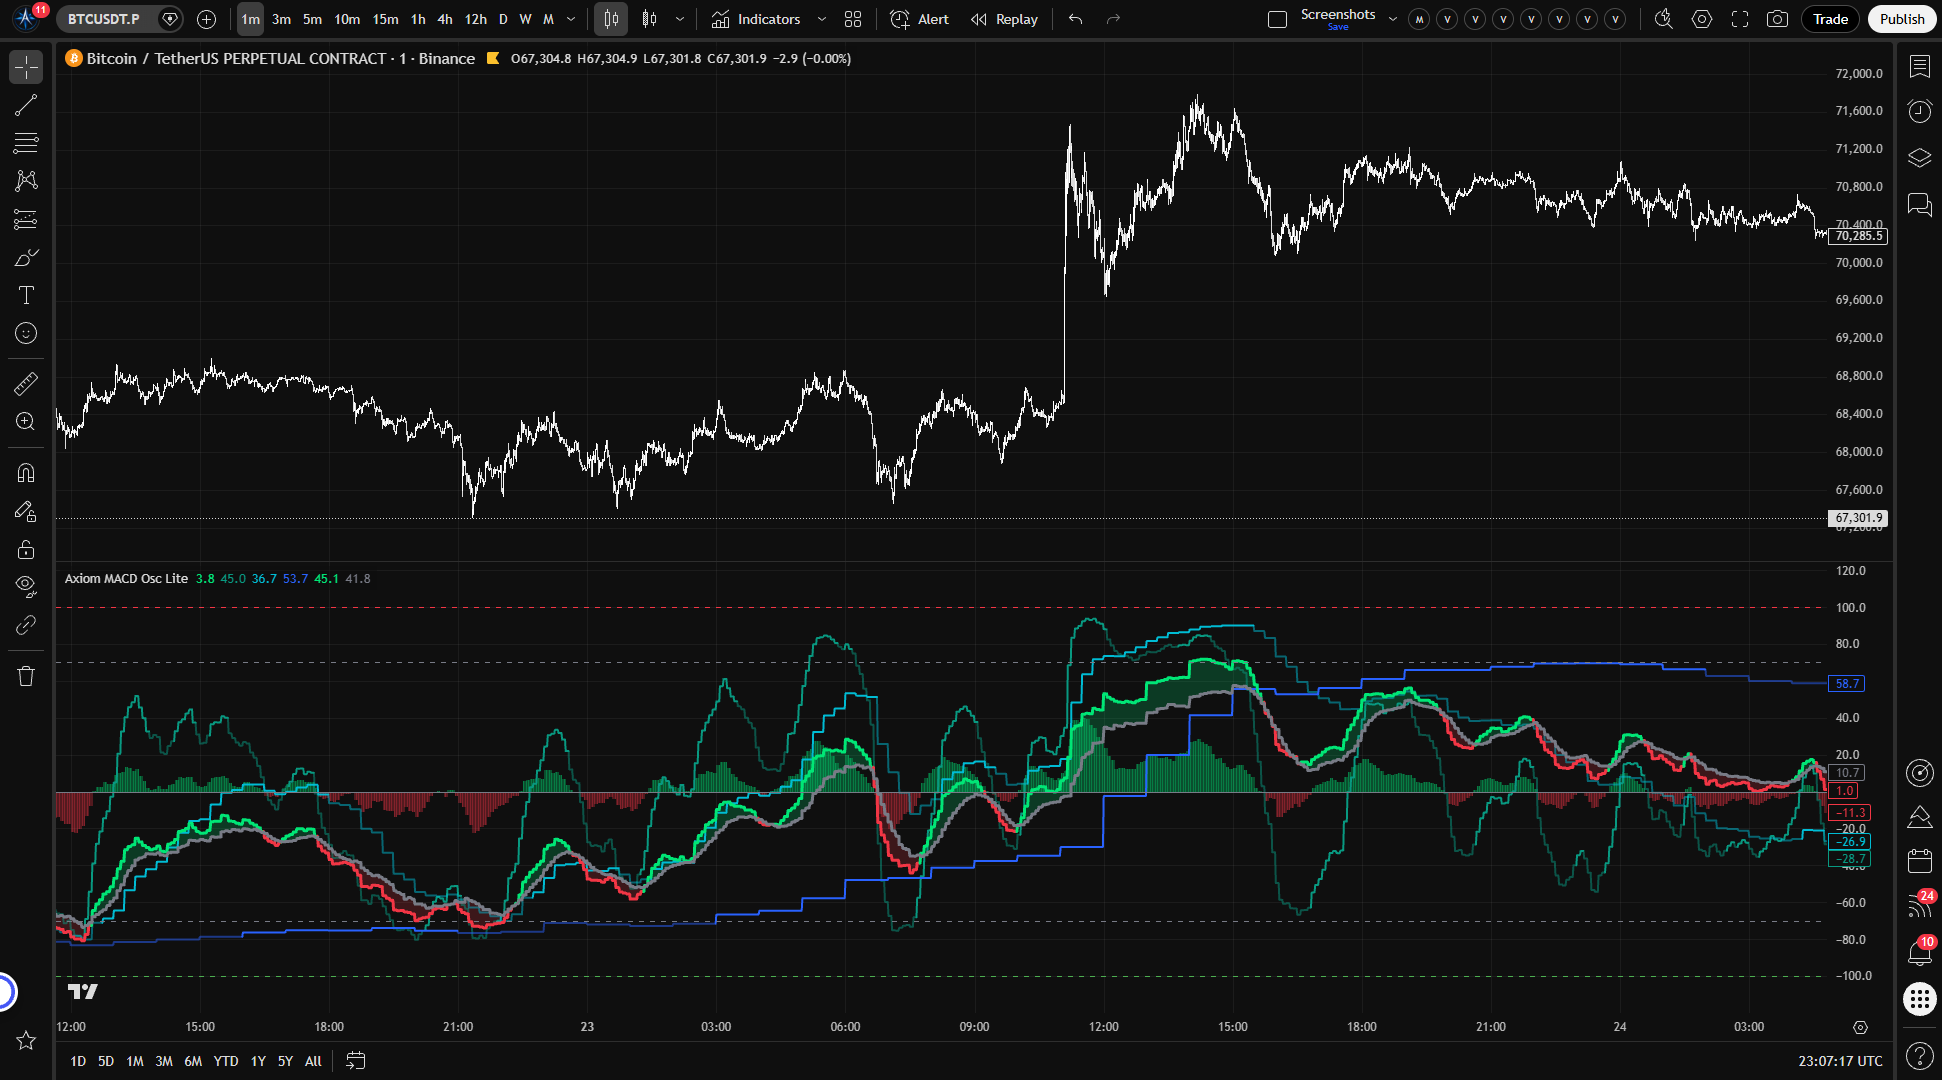
Confirm the visual output. Three slot K lines should appear in the oscillator pane with distinct colors (teal, aqua, blue). The blended K (lime when bullish, red when bearish) and blended D (gray) should be visible with fill between them. Histogram columns should plot around zero.
-
Confirm the bounded range. Every line should stay between -100 and +100.
-
Test the repaint control. Toggle On Bar Close off. Watch the slot values shift as the current higher-timeframe bar builds. Toggle it back on. Values should freeze at the last confirmed reading.
-
Verify independent slot behavior. The 60-minute slot's K line should update less frequently than the 5-minute slot's. Each slot responds to its own timeframe independently — that difference in update frequency is expected, not broken.
Settings
Per-slot settings
Each MACD slot (01, 02, 03) uses the same control structure. The explanations below apply to all three.
Enable — Turns the slot on or off. A disabled slot does not plot, does not contribute to the blend, and does not fire alerts. Disable any slot you are not using — leaving unused slots enabled dilutes the blended output with readings you are not watching.
Hide Plot — Removes the slot's K line from the chart, but the slot still feeds into the blend and fires alerts. Useful when you want a slot's weight in the composite without the visual noise. Easy to forget that a hidden slot is still shaping the blended reading.
Source — The price series fed to the MACD calculation. Default: close. Alternatives like hlc3 or ohlc4 produce a smoother input. Changing source changes what "convergence" and "divergence" mean for that slot — different price series produce different regime reads on the same market.
TimeFrame — The higher timeframe whose price and ATR data this slot uses. Defaults: 5 / 15 / 60. Must be greater than or equal to the chart timeframe. Violation produces a runtime error, not a silent failure.
Fast Length — Lookback for the fast MA in the MACD calculation. Default: 12. Shorter values produce more responsive convergence/divergence detection. Must be less than Slow Length — the script enforces this and throws a runtime error if it is not.
Slow Length — Lookback for the slow MA. Default: 26. Shorter values narrow the spread between fast and slow, reducing the magnitude of convergence readings. Very short slow lengths relative to the fast produce a noisy, shallow MACD line.
MACD MA Type — The moving average algorithm used for both the fast and slow MAs. Default: EMA. Options include every type in the Axiom Lite MA Library — SMA, EMA, WMA, ALMA, and others. If you select ALMA, the global ALMA Offset and Sigma parameters apply. One caveat: SWMA is fixed-length in the imported lite library, so it is not a meaningful choice for the fast/slow MACD pair.
Signal Length — Smoothing period for the Signal line (the MA of the MACD line). Default: 9. Shorter produces faster crossovers. Longer reduces whipsaw but adds delay to regime changes.
Signal MA Type — The MA algorithm for the Signal line. Default: EMA. Same options and considerations as MACD MA Type. If you select SWMA here, the Signal Length input no longer changes the smoothing window because SWMA is fixed-length in the imported library.
Blended Weight — This slot's relative contribution to the weighted composite. Default: 33.3 per slot. Weights auto-normalize across enabled slots, so only the ratios matter. Setting a weight to 0 keeps the slot's plot and alerts active but removes it from the blend — that is intentional, not a bug. A word on what you are blending: MACD readings from different instruments or timeframes that have no structural relationship will still produce a composite number. The math works regardless. Whether that number means anything is your question, not the oscillator's.
Optional Ticker — Overrides the chart symbol for this slot. Leave empty to use the chart ticker. ATR normalization puts cross-ticker readings on the same scale, so the comparison is real. Pick tickers where the ATR is meaningful — low-volume or delisted symbols degrade the normalization.
Line Width — Visual thickness of the slot's K line. Preference only.
Global settings
ATR Length — Lookback for the ATR that normalizes the MACD, Signal, and Histogram values across all slots. Default: 14. Shorter values make the normalization more reactive to recent volatility changes. Longer values smooth it out. Very short ATR lengths amplify noise in the normalized output.
ATR Sensitivity — The single most impactful global setting. It controls how quickly the oscillator approaches ±100. Default: 1.0. Higher values push moderate convergence or divergence toward the bounds, which means moderate and strong moves become harder to tell apart visually. Lower values keep the oscillator in the midrange, preserving more resolution between moderate and strong readings but reducing the total range the oscillator uses. The right value depends on your instrument, your timeframes, and how much of the bounded range you want the oscillator to occupy during normal conditions. Start at the default. Adjust if the output routinely pegs the bounds during ordinary trending moves or barely leaves the midrange during conditions where you know the convergence is significant.
Overbought Level / Oversold Level — Upper and lower reference lines within the bounded range. Defaults: +70 / -70. These mark configurable zones, not reversal signals. An oscillator reading near ±100 means the convergence or divergence is large relative to recent ATR. Strongly trending conditions can hold that reading for extended periods.
Plot Blended K/D — Shows or hides the composite K and D lines and their fill. Default: on. Turn off when you only want the individual slot readings.
Plot Blended Histogram — Shows or hides the composite histogram columns. Default: on. Turn off when you only care about the K/D lines.
Blended Line Width — Thickness of the blended K and D lines. Default: 3.
Enable Master Smoothing — Applies a final MA pass to the blended K, D, and Histogram after weighting. Default: off. Useful when the blended output is noisier than you want. The tradeoff is real: smoothing on top of already-smoothed values creates compounding lag. Use it deliberately.
Master MA Type — The MA algorithm for master smoothing. Default: EMA.
Master Length — Lookback for master smoothing. Default: 3.
On Bar Close? — The repaint control. Default: on. When enabled, each slot uses the last confirmed higher-timeframe value via a bar offset, and historical readings do not change after the fact. When disabled, slot output uses the current building bar and updates as new intrabar data arrives — values will shift until the HTF bar closes. This is a user choice, labeled clearly. Toggle it on a live chart to see the behavior firsthand.
ALMA Offset / ALMA Sigma / ALMA Floor Offset — Shared parameters that apply whenever ALMA is selected as an MA type anywhere in the indicator. Defaults: 0.85 / 6.0 / off. If no ALMA is active, these have no effect.
Alerts
20 alert conditions. Every one requires a confirmed bar before firing.
Per-slot alerts (9 total — 3 per slot)
| Alert | Fires when |
|---|---|
| MACD 01 / 02 / 03 Is Bullish | Slot enabled, K > D, bar confirmed |
| MACD 01 / 02 / 03 Is Bearish | Slot enabled, K < D, bar confirmed |
| MACD 01 / 02 / 03 Regime Flip | Slot enabled, regime changed on this bar, bar confirmed |
Blended alerts (9 total)
| Alert | Fires when |
|---|---|
| Blended MACD Is Bullish | Blended K > blended D, bar confirmed |
| Blended MACD Is Bearish | Blended K < blended D, bar confirmed |
| Blended MACD Regime Flip | Blended regime changed on this bar, bar confirmed |
| Blended MACD Crossed Above Zero | Blended K crossed above 0, bar confirmed |
| Blended MACD Crossed Below Zero | Blended K crossed below 0, bar confirmed |
| Blended MACD Overbought | Blended K crossed above the overbought level, bar confirmed |
| Blended MACD Oversold | Blended K crossed below the oversold level, bar confirmed |
| Blended Histogram Crossed Above Zero | Blended histogram crossed above 0, bar confirmed |
| Blended Histogram Crossed Below Zero | Blended histogram crossed below 0, bar confirmed |
Alignment alerts (2 total)
| Alert | Fires when |
|---|---|
| All MACD Slots Bullish | Every enabled slot that is currently returning values has K > D simultaneously, bar confirmed |
| All MACD Slots Bearish | Every enabled slot that is currently returning values has K < D simultaneously, bar confirmed |
Behavior note: The Bullish and Bearish regime alerts fire on every confirmed bar where the condition holds — not only on transitions. Regime Flip fires only on the bar where the state actually changes. Histogram zero-cross alerts fire on the crossing bar. For most use cases, set the TradingView alert frequency to "Once Per Bar Close."
For the geeks
A standard MACD value is denominated in whatever price units produced it. On a single chart with a single timeframe, that is fine. The moment you want to compare MACD behavior across timeframes or instruments, those units become the problem — a MACD of +2.00 on SPY at five minutes and +2.00 on Bitcoin at one hour are measuring the same concept at completely different magnitudes.
This oscillator resolves that by normalizing each MACD component independently through two steps.
First, the raw value — whether it is the MACD line, the Signal, or the Histogram — gets divided by ATR computed within the same symbol and timeframe context. The result is a unitless ratio: the convergence or divergence expressed as a proportion of recent volatility rather than in price terms.
Second, that ratio gets scaled by ATR Sensitivity and then passed through a hyperbolic tangent function, which maps any real number onto a bounded range (scaled here to -100/+100). Tanh is an S-shaped curve: values near zero pass through roughly linearly, while values far from zero compress toward the bounds asymptotically.
When convergence or divergence is moderate, the oscillator responds proportionally — a move twice as large in ATR terms produces roughly twice the oscillator change. When divergence becomes extreme, the oscillator still rises, but each additional unit of divergence produces a smaller oscillator change than the one before. The reading approaches ±100 but does not reach it. That compression is what keeps one heavily trending slot from pinning the oscillator at the wall and drowning out everything else in the pane.
ATR Sensitivity is the dial that sets where the compression begins to bite. At low values, only major divergence events push the oscillator near the bounds. At high values, moderate moves already get there. Neither is correct in the abstract — it depends on how much resolution you need in the midrange versus how much you need at the extremes.
All three components — K, D, and Histogram — are normalized through this same process independently. The histogram in this oscillator is the ATR-normalized raw MACD-minus-Signal difference, not the difference of the already-normalized K and D values. Near the bounds, the plotted histogram may not visually match the gap between K and D exactly. That is a consequence of normalizing each component on its own terms.
To verify the saturation behavior: set ATR Sensitivity to 0.3 and watch the oscillator stay mostly in the midrange during trending moves. Raise it to 2.0 or higher and watch moderate crossovers push readings near ±100. Compare a slot on your chart ticker with a slot on a different ticker and confirm both stay bounded despite different price levels and volatility profiles.
FAQ
Does this indicator repaint? When On Bar Close is enabled — which it is by default — no. Each slot uses the last confirmed higher-timeframe value, and historical readings stay put. When On Bar Close is off, the output tracks the current building bar and changes as new data arrives. That is repainting by design, and it stops when the higher-timeframe bar closes. You can see the difference on any live chart: toggle the setting off, watch the values shift mid-bar, then toggle it back on and confirm they lock.
How is this different from a standard MACD? It starts with the same calculation — fast MA minus slow MA, a signal line, and a histogram. Then it normalizes each component by ATR and compresses the result through a saturation curve that caps the output at -100/+100. A standard MACD is unbounded and priced in the units of the chart. This oscillator is bounded and unitless. That difference is what makes it possible to put a 5-minute MACD and an hourly MACD in the same pane and have the comparison mean something.
Does multi-timeframe alignment make the signal more reliable? Alignment means the convergence/divergence condition exists across the configured slots that are currently returning values right now. It does not mean it will still exist on the next bar. Three slots showing the same regime is a fact about the present state of those moving averages — not a probability statement about what follows. Use it as information, not confirmation.
Can I blend MACD readings from different tickers? You can. ATR normalization strips out the price-level and volatility differences, so the readings share a scale. That makes cross-ticker blending mathematically sound. Whether it is analytically useful depends on whether the instruments have a relationship your process can act on. The oscillator puts the numbers on the same ruler. Deciding what to measure together is still your call.
What does ATR Sensitivity do? It sets how fast the oscillator saturates toward ±100. The ATR-normalized value gets multiplied by this parameter before the saturation curve compresses it. Raise it and moderate convergence events reach the extremes sooner — useful if you want the oscillator to flag those conditions clearly, but the midrange loses resolution. Lower it and the oscillator stays calmer, preserving the ability to distinguish moderate from strong, but undersized readings may not be visible enough to act on. Tune it for your instrument and your timeframes until the oscillator occupies a useful portion of the range without living at the walls.
Limitations
Normalization depends on volatility context. The same raw MACD difference can produce different oscillator values when ATR changes. A reading of +60 during a quiet week and +60 during a volatile one do not reflect the same absolute degree of convergence — they reflect the same proportion of their respective volatility environments. When the ATR environment shifts, the ruler the oscillator uses shifts with it.
Resolution compresses at the extremes. The saturation curve trades linearity for boundedness. Near ±100, equal-sized increases in convergence produce progressively smaller oscillator changes. The practical cost: once two readings are both near the bounds, telling the difference between "strongly diverging" and "extremely diverging" is harder.
The blend cannot tell you whether the slots agree. A bullish blended regime might represent three slots in unison. It might represent one heavily weighted slot dragging the composite while the others sit neutral. The blend is a weighted average. If the distinction between alignment and single-slot dominance matters to your decisions, check the individual slot lines.
Crossovers describe what happened, not what will. A MACD crossover — per-slot or blended — marks a shift in the relative position of two moving averages. It is a statement about the convergence/divergence relationship at this point. It is not a forecast.
Extreme values are not reversal signals. A reading near ±100 means convergence or divergence is large relative to recent ATR. Markets can hold that condition for an extended stretch. Overbought and oversold reference lines are markers within the bounded range, not countdown timers.
The histogram is normalized independently from K and D. The histogram here is the ATR-normalized raw MACD-minus-Signal value, not the difference of the already-normalized K and D lines. Near the bounds, the histogram may not visually track the K-D gap the way a standard MACD histogram tracks its MACD-minus-Signal line. The discrepancy comes from the normalization being applied to each component on its own terms.
Support and training
Questions, feedback, and training resources are available through the AxiomCharts website.
Disclaimer
This indicator is an analytical tool, not financial advice. It does not generate trade signals, recommend positions, or guarantee outcomes of any kind. All trading involves risk, including the possibility of loss. Past behavior of any indicator does not predict future results. Use this tool as one component of a broader process and always apply your own judgment and risk management.
Free access
Read everything on this page first. Open it on TradingView only when you are clear on what it does and what it does not do.
Open in TradingViewRelated products
If this one is close but not quite right, there may be a better fit nearby for the same kind of chart work, testing need, or workflow gap.
Keep looking
If this one is close but not quite right, there may be a better fit nearby for the same kind of chart work, testing need, or workflow gap.
Find your starting pointWeighing a few options against each other?
Tell us what you are trying to accomplish and we will help you narrow it down honestly.