indicator | Oscillators / MACD / Momentum
Axiom MACD Osc Pro
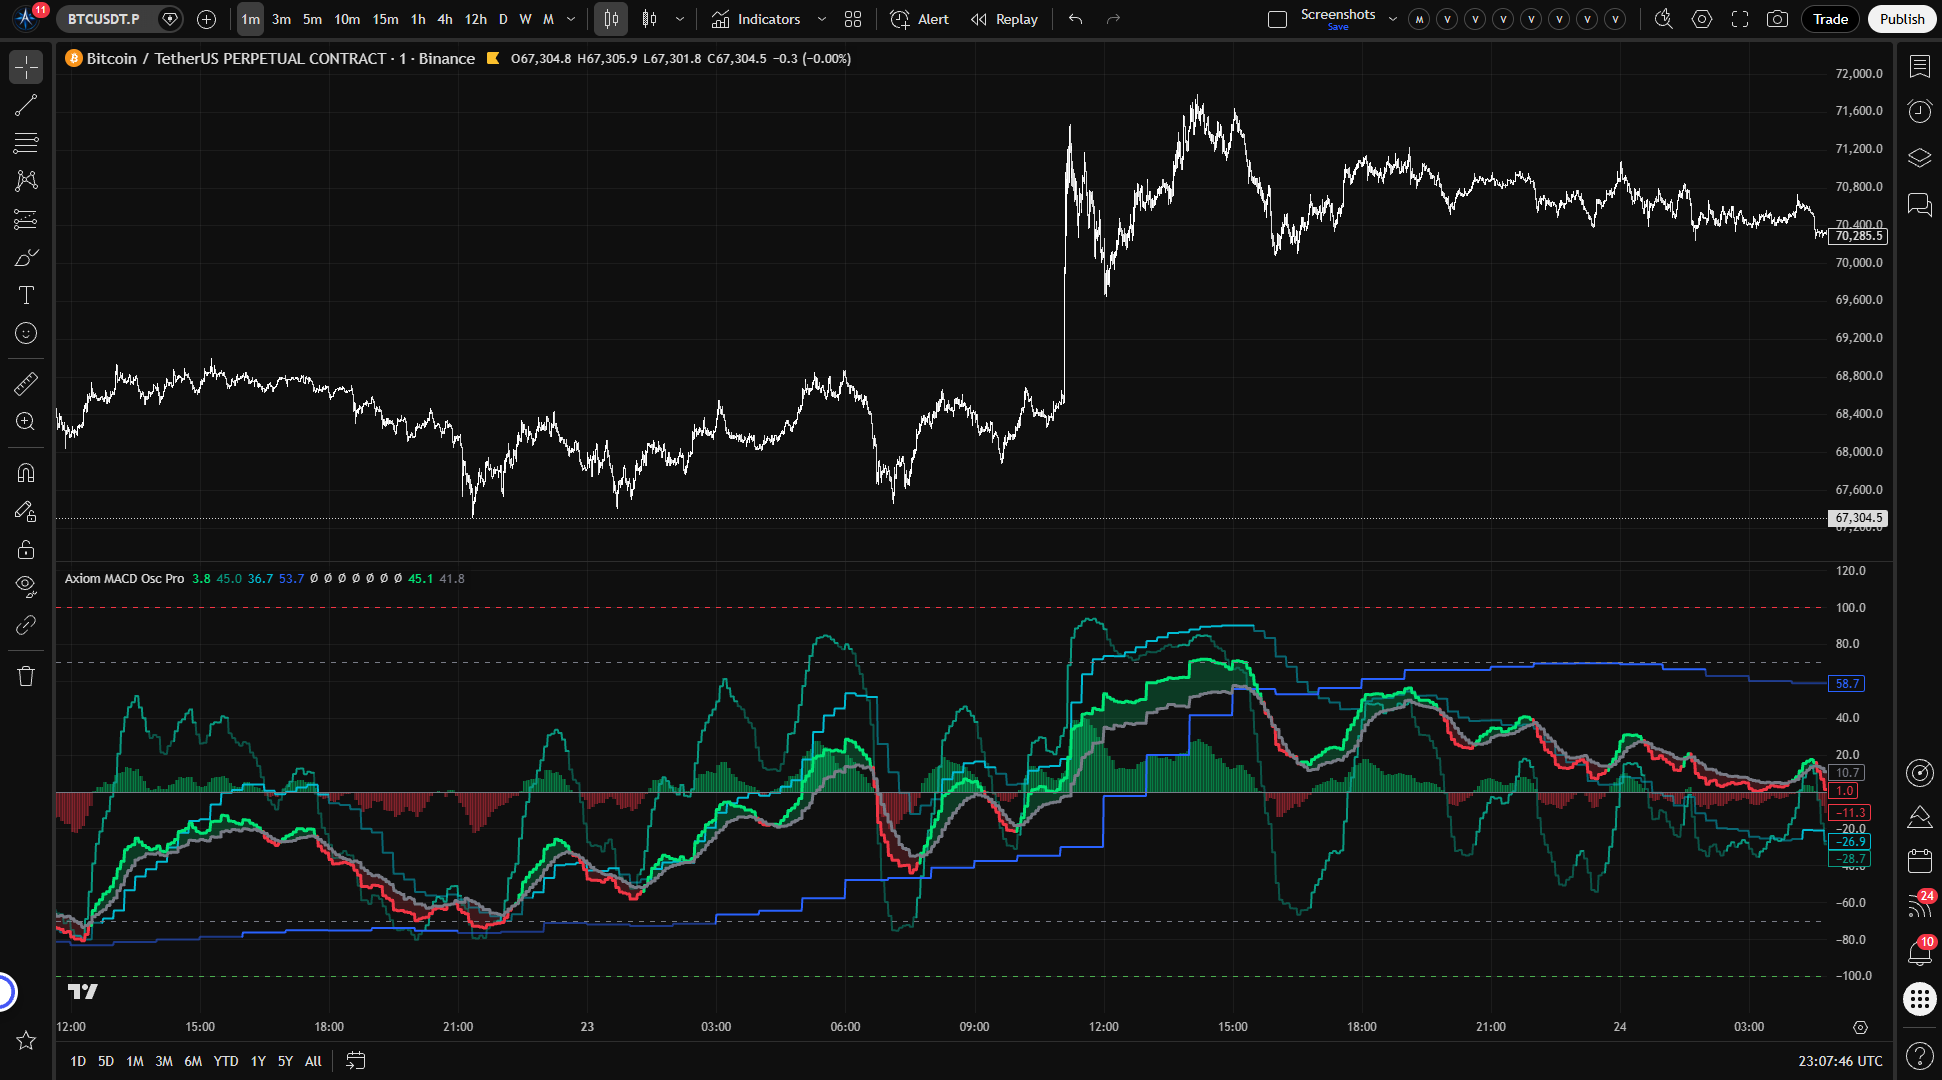
Axiom MACD Osc Pro runs up to ten MACD slots, normalizes every component against recent volatility, and blends the active readings into one bounded pane. It is built for traders who already use MACD across timeframes and want rigorous comparison without hidden repaint behavior or fake certainty.
Last updated: Apr 4, 2026
Crypto / Futures / Stocks / Forex / Indices | 1m / 5m / 15m / 1H / 4H / 1D
Best-fit markets
Primary timeframes
Product details
Explore the details to see whether the tool fits the problem you are trying to solve for.
Axiom MACD Osc Pro
Overview
If you check MACD across multiple timeframes before you act, you already know the problem: 3.2 on the five-minute and 48.7 on the daily are not the same kind of number. One is scaled to a low-volatility intraday move, the other to weeks of price range. Comparing them by eye — "both are positive, so momentum agrees" — is fast, but it is not honest. And if any of those readings are repainting without telling you, the comparison was never real in the first place.
Axiom MACD Osc Pro runs up to ten independent MACD calculations, each on its own timeframe and optionally its own symbol, normalizes every result against recent volatility, and maps them all into a fixed –100 to +100 range. Once they share a scale, it blends them by user-assigned weights into a single composite reading.
The result is one oscillator panel where you can see whether your chosen timeframes are pulling in the same direction or coming apart — without stacking separate MACD instances and doing the mental conversion yourself.
Who this is for: Traders who already use MACD in a multi-timeframe workflow and want that comparison to be rigorous, configurable, and on a common scale. You should be comfortable adjusting indicator settings and thinking about what each timeframe contributes to your process.
Who this is not for: If MACD is not part of your current approach, or you want a plug-and-play signal that tells you when to buy and sell, this is not the right tool. It reads momentum alignment. It does not make decisions for you.
A note on the values: The numbers in this oscillator will not match a standard MACD. That is intentional. The normalization step is what makes cross-timeframe comparison meaningful instead of approximate. If you compare a same-timeframe slot with On Bar Close = OFF, the regime and zero-line structure should line up closely with a standard MACD using the same parameters. If On Bar Close = ON, that slot is intentionally one confirmed bar behind. The absolute values are on a different scale either way. The "For the geeks" section below explains why.
Features
Per-slot K lines (up to 10) Each enabled slot plots its own oscillator line showing that timeframe's momentum reading, already normalized to the –100/+100 range. The line colors shift based on regime — when the slot's fast line is above its signal, you see the bullish color; below, the bearish. You can see at a glance which timeframes agree and which ones are lagging or flipping.
Blended K and D lines The weighted composite of all enabled slots. The K line reflects the blended momentum direction; the D line is the blended signal reference. When K is above D, the composite reads bullish. When K is below D, bearish. These are the lines you watch when you care about the aggregate read rather than individual timeframes.
K/D fill A shaded region between the blended K and D lines that makes the current regime state visible without reading exact numbers. Useful when scanning charts quickly.
Blended histogram Columns plotted around zero showing the weighted composite of each slot's normalized MACD-minus-signal value. Expanding bars usually mean that spread is strengthening across the contributing slots; shrinking bars usually mean it is easing. Useful context, but it is not literally the same thing as blended K minus blended D.
Reference lines Fixed lines at +100, 0, and –100 anchor the oscillator range. Configurable overbought and oversold thresholds (default: +70 / –70) mark when the composite is in an extended reading zone.
Per-slot configurability Each slot has its own timeframe, optional ticker override, MA type selections for both the MACD and signal calculations, weight in the blend, and an On Bar Close toggle that controls repainting behavior. Slots can be hidden from the chart while still contributing to the blend and alerts.
Master smoothing An optional final smoothing pass applied to the blended K, D, and histogram after blending. Off by default. Turn it on when the composite output is too noisy for your read and you want a calmer line — with the understanding that smoothing adds lag.
How to use
-
Add the indicator to a chart whose timeframe is equal to or lower than the lowest slot timeframe you plan to use. If your chart is on the 15-minute and you set a slot to the 5-minute, the indicator will throw a runtime error and will not load. This is a safety guard, not a bug.
-
Check the defaults. Slots 01 through 03 are enabled at 5-minute, 15-minute, and 60-minute with equal weight. The remaining seven slots are off. If these timeframes match your process, you can read the output immediately. If not, adjust the slot timeframes to the ones you actually check.
-
Read the regime. Look at the blended K and D lines. K above D means the weighted composite is bullish. K below D means bearish. The per-slot lines tell you whether the individual timeframes agree with the composite or diverge from it.
-
Check for alignment. If every enabled slot is in the same regime direction (K above D or K below D), momentum across those timeframes is aligned. The zero line is separate context. If the slot lines are mixed across regimes, momentum is mixed. Both readings are informative. Alignment is not a buy signal. Divergence is not a sell signal. They tell you what momentum is doing, not what you should do about it.
-
Adjust to your process. Change slot timeframes, weights, and MA types to reflect the way you actually trade. This indicator does not have a "best" configuration. It has the configuration that matches your process. Spend a few minutes getting that right before relying on the output.
Settings
Per-slot settings (repeats for each of the 10 slots)
- Enable — Turns the slot on or off. An enabled slot contributes to the blend, fires its own alerts, and plots its line (unless hidden). Slots 01–03 are on by default; 04–10 are off.
- Hide Plot — Hides the slot's line on the chart. The slot still contributes to the blend and alerts. Useful when you want a slot in the composite without the visual clutter.
- Source — The price series the slot evaluates. Defaults to close. Rarely needs changing unless your MACD process uses a non-standard source.
- Timeframe — The timeframe this slot requests data from. Must be equal to or higher than the chart timeframe. Setting it lower triggers a runtime error. Defaults: Slot 01 = 5m, Slot 02 = 15m, Slot 03 = 60m.
- Fast Length / Slow Length — Standard MACD lookback periods. Defaults: 12 / 26. Slow must be greater than Fast. Adjust to match your MACD process — shorter is not better, it is noisier.
- MACD MA Type / Signal MA Type — The moving average algorithms used for the MACD and signal line calculations. Default: EMA for both. Multiple MA types are available through the settings panel, including adaptive and specialty algorithms. When using advanced types (ALMA, KAMA, Jurik, etc.), the relevant tuning parameters appear in the Power User section.
- Blended Weight — This slot's relative influence in the weighted composite. Weights normalize automatically across all enabled slots. A weight of 0 keeps the slot's individual plot and alerts active without affecting the blend. Defaults: 33.3 for slots 01–03, 0 for slots 04–10. Be intentional about weight distribution — over-weighting one slot defeats the point of multi-timeframe comparison.
- Optional Ticker — Overrides the chart symbol for this slot. Use when comparing momentum across different instruments (e.g., tracking index momentum alongside an individual name). Leave empty to use the chart symbol. Compare instruments that have an analytical relationship, not arbitrary pairs.
Per-slot Power User settings
- On Bar Close? — The most important toggle to understand. ON (default): the slot uses the prior confirmed bar for that slot's requested timeframe. History is stable and will not change after the bar closes. This is the non-repainting mode. OFF: the slot uses the currently building bar for that slot's requested timeframe. Values update intrabar, which is more responsive, but the reading can and will change until that bar closes. This is intentional repainting — the user is opting into it, not being tricked by it. If the slot is set to the chart timeframe, ON still keeps the slot one confirmed bar behind the live bar.
- Advanced MA parameters (ALMA Offset/Sigma/Floor, KAMA/FRAMA Fast/Slow, Jurik Phase/Power, Laguerre Alpha, VAMA Vol Length) — These apply only when the corresponding MA type is selected for the MACD or Signal calculation. Leave at defaults unless you have a specific reason to tune them.
General oscillator settings
- ATR Length — Lookback for the volatility measure used in normalization. Default: 14. Shorter = more reactive normalization; longer = smoother. Changing this affects how the bounded range maps to price movement.
- ATR Sensitivity — Controls how quickly the oscillator reaches the –100/+100 boundaries. Default: 1.0. Higher values cause the oscillator to saturate toward the extremes faster; lower values keep more resolution in the middle of the range. Setting this too high makes the oscillator binary — readings cluster near the boundaries instead of spreading across the range.
- Overbought / Oversold Level — Thresholds for the reference lines and OB/OS alerts. Defaults: +70 / –70. Adjust to match your definition of "extended." These are reference levels, not action triggers.
Display settings
- Plot Blended K/D — Toggles the blended K and D lines. Default: ON. Turn off if you only want to see individual slot lines.
- Plot Blended Histogram — Toggles the blended histogram columns. Default: ON. Turn off to reduce visual density.
- Blended Line Width — Cosmetic thickness of the blended K/D lines. Default: 3.
Master smoothing settings
- Enable Master Smoothing — Applies a final moving average pass to the blended K, D, and histogram. Default: OFF. Smoothing reduces noise but adds lag to the composite output.
- Master MA Type / Master Length — The MA algorithm and lookback for the smoothing pass. Defaults: EMA / 3. Advanced MA parameters apply when using specialty types.
Alerts
All 31 alert conditions are chart-bar-close gated: they only evaluate after the current chart bar is fully confirmed. That removes same-bar noise, but it does not magically confirm a higher-timeframe slot that has On Bar Close = OFF. If you set an alert and it does not fire until the bar closes, that is the design working as intended — not a delay.
Per-slot alerts (available for each of the 10 slots)
- MACD NN Is Bullish — Fires on each confirmed bar where the slot's K is above its D. Tells you that timeframe's momentum is bullish.
- MACD NN Is Bearish — Fires on each confirmed bar where the slot's K is below its D. Tells you that timeframe's momentum is bearish.
(NN = slot number. Alerts fire only for enabled slots.)
Blended alerts
- Blended MACD Is Bullish — Blended K above blended D.
- Blended MACD Is Bearish — Blended K below blended D.
- Blended MACD Regime Flip — The composite just switched from bullish to bearish or the reverse.
- Blended MACD Crossed Above Zero — Blended K crossed above the zero line.
- Blended MACD Crossed Below Zero — Blended K crossed below the zero line.
- Blended MACD Overbought — Blended K crossed above the overbought threshold.
- Blended MACD Oversold — Blended K crossed below the oversold threshold.
- Blended MACD Histogram Crossed Above Zero — Composite momentum acceleration turned positive.
- Blended MACD Histogram Crossed Below Zero — Composite momentum acceleration turned negative.
Alignment alerts
- All MACD Slots Bullish — Every enabled slot has K above D. Complete multi-timeframe bullish alignment.
- All MACD Slots Bearish — Every enabled slot has K below D. Complete multi-timeframe bearish alignment.
For the geeks
This is not textbook MACD. A standard MACD line is unbounded — its value scales with the price and volatility of whatever you are looking at. That makes it useful on one chart, but unreliable for comparing readings across timeframes or across different symbols. A MACD of 5.0 on a low-cap altcoin and 5.0 on the S&P 500 are not measuring the same thing.
This indicator divides each raw MACD, signal, and histogram value by recent volatility (measured through ATR over a configurable lookback), applies a scaling factor, and then passes the result through a saturating function that compresses it into the –100 to +100 range. Small momentum readings stay proportional. Large readings curve toward the boundary and flatten out rather than stretching to infinity.
The benefit is real comparability: a reading of +60 from the 5-minute slot and +60 from the daily slot genuinely mean something similar about momentum strength relative to recent volatility on each timeframe. The tradeoff is compression at the extremes. Once a reading is deep in the saturation zone, a very large move and a moderately large move can produce similar numbers. You lose the ability to distinguish "extended" from "extremely extended" at the tails. In exchange, you gain a scale where the middle of the range is meaningful and where slots from different timeframes can share a panel honestly.
The ATR Sensitivity setting controls how quickly readings approach the boundaries. Higher sensitivity saturates faster (more binary output); lower sensitivity keeps more resolution in the center.
How to verify: Apply a single slot on the chart timeframe, temporarily set that slot's On Bar Close to OFF, then open a standard MACD alongside it. The regime and zero-line structure should line up closely. If On Bar Close is ON, the slot is intentionally one confirmed bar behind on a same-timeframe comparison. The absolute values will still differ — that difference is the normalization doing its job.
FAQ
Does this indicator repaint? In the default configuration, no. Every slot defaults to On Bar Close = ON, which means it uses the prior confirmed bar for that slot's requested timeframe. Once that bar closes, its value will not change. If you turn On Bar Close OFF for a slot, that slot will update intrabar using the currently building bar — values can and will shift until that bar closes. That is intentional. It gives you faster responsiveness at the cost of stability. You can verify this yourself: toggle On Bar Close off on a live chart, watch the slot line move intrabar, then toggle it back on and confirm the line snaps to the prior bar's settled value.
Why don't the values match a standard MACD? Because they are normalized. The indicator divides raw MACD values by recent volatility and maps the result into a fixed –100 to +100 range so that readings from different timeframes and symbols can be compared on the same scale. The direction of the line and the zero-crossings will match a standard MACD closely. The absolute numbers will not — and they are not supposed to.
Can I use multi-timeframe alignment as a buy or sell signal? Alignment tells you that momentum across your chosen timeframes agrees on direction. That is useful context. It does not tell you when to enter, where your stop goes, or whether the price structure supports the trade. It is one input into a decision, not the decision itself. Treating full alignment as an automatic trigger is one of the most common ways to misuse a multi-timeframe tool.
What happens if I set a slot timeframe lower than my chart timeframe? The indicator throws a runtime error and will not load. This is a deliberate safety guard. Every slot's timeframe must be equal to or higher than the chart timeframe. If you see a runtime error after adding the indicator, check that none of your enabled slots are set to a timeframe below the chart.
Should I enable all 10 slots? Only if you have a reason for each one. Enable the timeframes that are actually part of your process. Each additional slot adds a data request and a line on the chart. More slots do not produce a more accurate signal — they produce a more crowded composite that blends more inputs. If you check three timeframes, enable three slots. The extra capacity is there for traders whose process genuinely spans more timeframes or symbols, not as a default to max out.
Limitations
- Not an entry or exit system. This indicator reads momentum alignment. It does not generate trade signals, set stop levels, or replace the work of interpreting what momentum means in context. It is one instrument in a process, not the process itself.
- Not a substitute for price structure. Momentum can align across every timeframe you check and the trade can still fail because price is sitting at a major level, volume is absent, or the setup does not exist. Alignment is a filter, not a thesis.
- Extremes compress. The normalization that makes cross-timeframe comparison possible also compresses readings at the tails. Once the oscillator is deep in the saturation zone, a strong move and a very strong move can look alike. The overbought/oversold levels help mark when you are in that zone, but the distinction between "extended" and "deeply extended" is limited by design.
- The blend is only as good as your choices. The composite reflects the timeframes, weights, and MA types you configured. If the slots do not match your actual process, or if the weights are skewed without reason, the blended output will be misleading in ways the indicator cannot warn you about. Spend time with the configuration before trusting the output.
- Repainting when On Bar Close is off. Any slot with On Bar Close set to OFF will update its values intrabar and those values can change until the higher-timeframe bar closes. This is a feature, not a defect — but if you act on an intrabar read that shifts after the bar closes, that is the cost of the responsiveness you opted into. The default is non-repainting for a reason.
Support and training
For setup guidance, usage examples, and support, visit the AxiomCharts website. Pro-tier indicators include documentation and training resources designed to help you get from first install to a working configuration without guesswork.
Disclaimer
This indicator is a technical analysis tool, not financial advice. It does not predict future price movement, guarantee returns, or replace independent judgment. Past indicator behavior does not guarantee future results. All trading involves risk, including the risk of loss. Use this tool as part of your own analysis process and at your own discretion.
Related products
If this one is close but not quite right, there may be a better fit nearby for the same kind of chart work, testing need, or workflow gap.
Keep looking
If this one is close but not quite right, there may be a better fit nearby for the same kind of chart work, testing need, or workflow gap.
Find your starting pointWeighing a few options against each other?
Tell us what you are trying to accomplish and we will help you narrow it down honestly.