indicator | Oscillators / RSI / Momentum
Axiom RSI Osc Lite
Axiom RSI Osc Lite runs up to three RSI slots, smooths each one into an RSI and signal pair, converts the output to a zero-centered bipolar scale, and blends the active slots into one readable pane. It is for traders who already use RSI and want faster timeframe comparison without pretending the blend is a signal.
Last updated: Apr 4, 2026
Crypto / Futures / Stocks / Forex / Indices | 1m / 5m / 15m / 1H / 4H / 1D
Best-fit markets
Primary timeframes
Product details
Explore the details to see whether the tool fits the problem you are trying to solve for.
Axiom RSI Osc Lite
Overview
RSI is one of the oldest momentum reads in technical analysis and one of the simplest to check on a single chart. The difficulty starts the moment you want to see what RSI looks like on a different timeframe. Checking means opening another chart, applying RSI, reading the value, switching back, and trying to hold the numbers together while both charts keep moving. By the time you've checked three timeframes, the first reading may already be wrong.
Axiom RSI Osc Lite runs up to three independent RSI calculations, each on its own configurable timeframe and optional ticker. Every slot smooths raw RSI through a user-selected moving average to produce the RSI line, then smooths that RSI line through a second moving average to produce a Signal line.
Each slot's RSI and Signal are then converted from the standard 0–100 RSI range to a -100/+100 scale centered on zero. Above zero means RSI is above its midpoint. Below zero means it is not. The conversion is linear: an RSI of 75 becomes +50, an RSI of 25 becomes -50, with no compression at the extremes. Enabled slots blend into a single weighted composite RSI and Signal pair. Optional master smoothing can be applied after blending.
This is a momentum gauge, not a directional forecast. It helps you see whether buying pressure is outpacing selling pressure on each timeframe you configure and whether those readings agree or diverge. Crossovers and regime shifts are observations about the current state of the RSI calculation, not trading instructions.
Who this fits: Someone who already reads RSI as a measure of buying versus selling pressure and wants to compare that read across timeframes or instruments on a shared axis. Someone willing to configure slot timeframes, smoothing types, and blend weights to match their own process.
Who this does not fit: Someone expecting RSI crossovers or extreme readings to serve as automatic entry or exit signals. Someone who wants an indicator that works without opening the settings panel. Someone who treats multi-timeframe agreement as proof that a move will continue.
Two things to understand before interpreting the output:
-
Smoothing lag is cumulative, but not every layer hits the same output. RSI(14) already carries its own lookback history. RSI Smoothing delays the plotted slot RSI line. Signal Smoothing does not move that slot plot; it delays the internal Signal line that controls regime flips and the blended Signal. If you enable Master Smoothing, the blended RSI and blended Signal get one more MA pass after weighting. Cleaner output always costs time.
-
The blend is a weighted average, not a vote. A bullish blended RSI does not necessarily mean all three slots turned bullish at the same time. It means the weight-adjusted composite lands above the weight-adjusted Signal. One heavily weighted slot can tilt the blend while the other two sit near zero.
Does not repaint when On Bar Close is enabled, which is the default. When On Bar Close is off, slot values update in real time as the higher-timeframe bar builds and will change until that bar closes. That is a deliberate mode, not a defect. You can verify the difference on any live chart by toggling the setting.
Why this matters
Checking RSI across timeframes means leaving your chart and coming back with a number held in memory. The gap between those two moments matters more than it seems the RSI that read 60 when you left might sit at 52 by the time you've formed a view on the shorter timeframe. You end up comparing a live reading against a stale one, and the conclusion you draw from that comparison carries the error forward.
Stacking those reads in one bounded pane does not sharpen any individual RSI calculation. What it changes is timing: every slot updates at the same moment, so agreement or disagreement between timeframes is observed, not reconstructed.
Features
Slot RSI lines (up to 3) Each slot computes RSI on its own configurable timeframe and optional ticker, smooths it through a user-selected moving average, and converts the result to the bipolar -100/+100 scale. Color shifts when the slot's RSI crosses its Signal one tint when RSI leads, another when it trails. Each line shows that timeframe's momentum read on the shared axis.
Blended RSI line Weight-normalized composite of all enabled slots' RSI values. A single line showing the weight-adjusted momentum composite across your configured timeframes or tickers. Appears lime when blended RSI is above blended Signal, red when below.
Blended Signal line Weight-normalized composite Signal derived from the individual slots' smoothed RSI values. The relationship between blended RSI and blended Signal defines the composite regime: RSI above Signal is the bullish read, RSI below Signal is the bearish read.
RSI/Signal fill Shaded region between blended RSI and blended Signal. Widening fill means the composite RSI is pulling further from its Signal the regime is strengthening. Narrowing fill means that gap is closing.
Reference lines Horizontal grid at -100, oversold (-70 default), zero, overbought (+70 default), and +100. OB/OS levels are configurable. These mark zones, not reversal thresholds.
How to use
-
Add to a chart. A 1-minute chart works well for initial verification the default slot timeframes are 5-minute, 15-minute, and 60-minute, which all satisfy the requirement that each slot's timeframe must be greater than or equal to the chart timeframe.
-
Review the defaults. Three slots enabled at 5m / 15m / 60m. RSI length 14. SMA of length 3 for both RSI Smoothing and Signal. Equal blend weights (33.3 each). On Bar Close enabled.
-
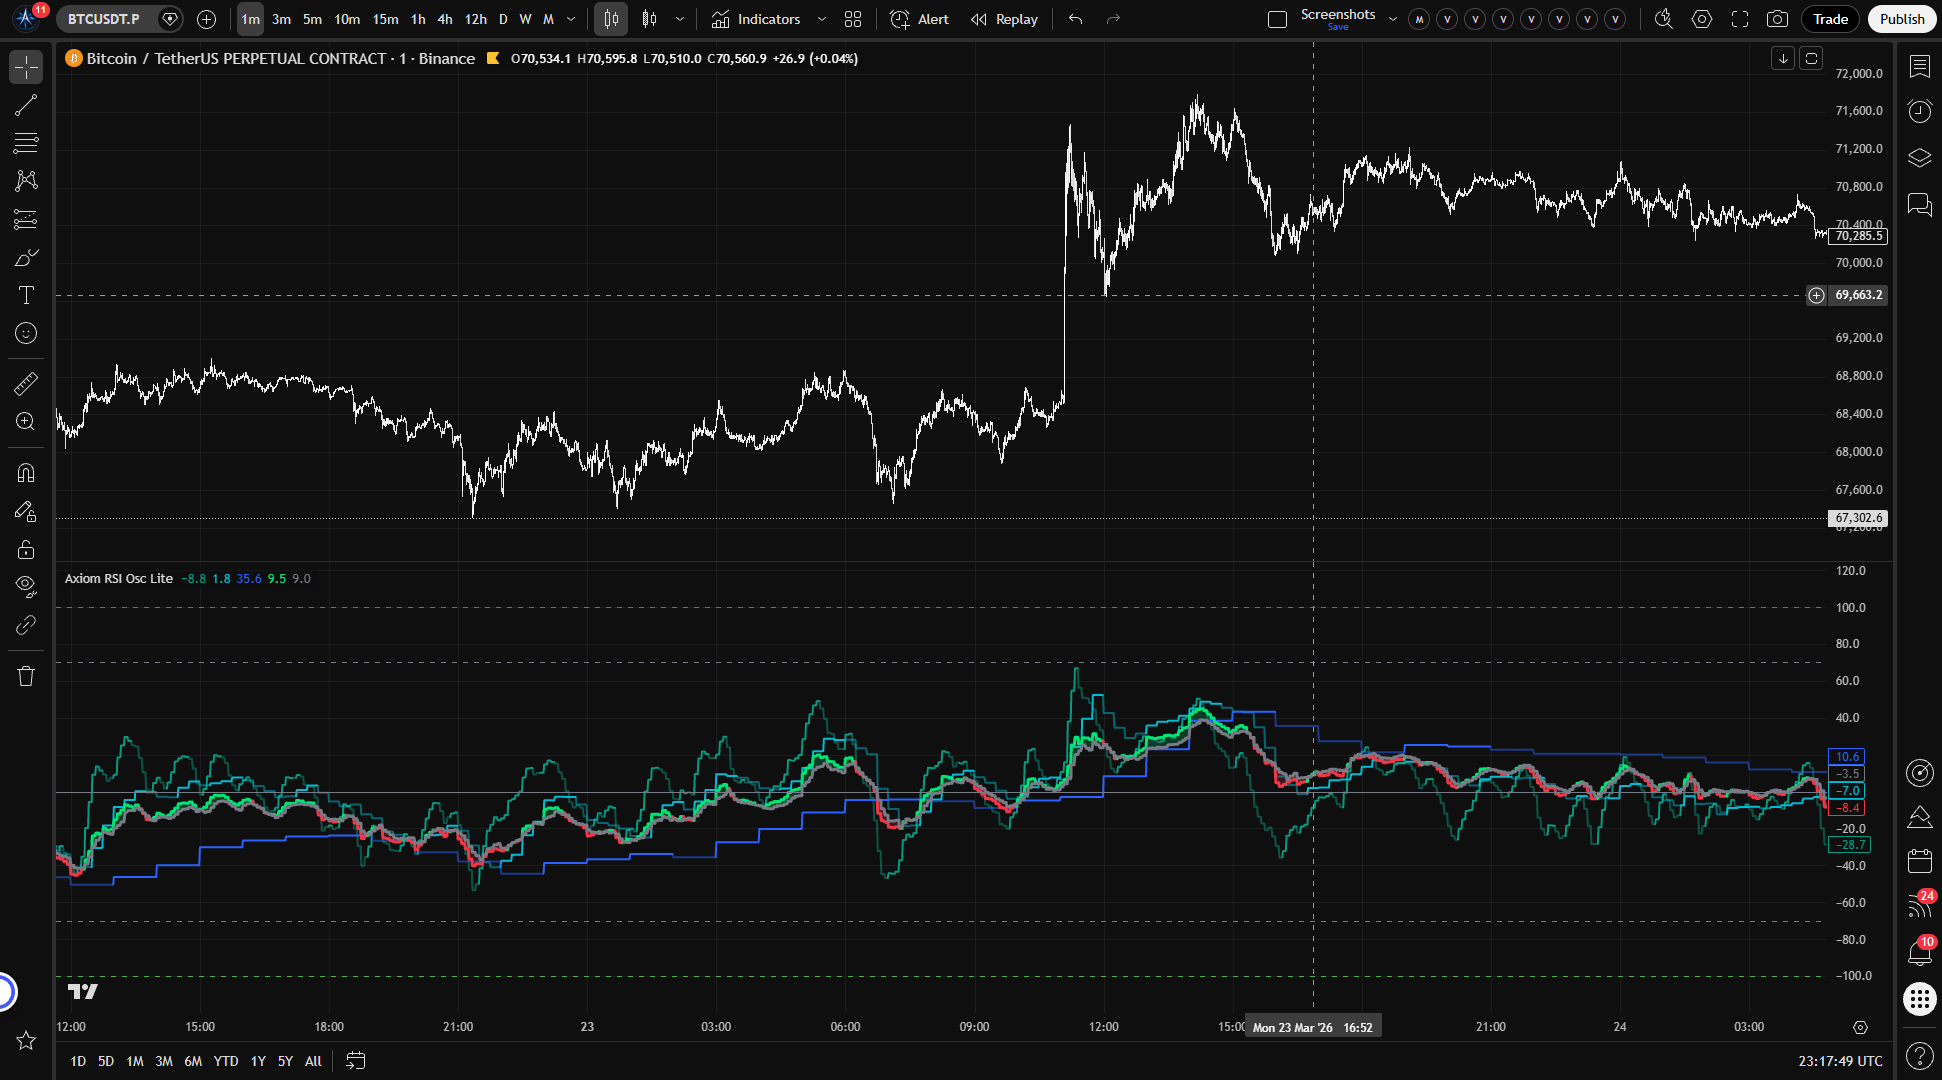
Confirm the visual output. Three slot RSI lines should appear in the oscillator pane with distinct colors (teal, aqua, blue). The blended RSI (lime/red) and blended Signal (gray) should be visible with fill between them.
-
Confirm the bounded range. Every line should stay between -100 and +100.
-
Test the repaint control. Toggle On Bar Close off. Watch the slot values shift as the current higher-timeframe bar builds. Toggle it back on. Values should freeze at the last confirmed reading.
-
Verify independent slot behavior. The 60-minute slot should update less frequently than the 5-minute slot. Each slot responds to its own timeframe the difference in update speed is expected, not broken.
Settings
Per-slot settings
Each RSI slot (01, 02, 03) uses the same control structure. The explanations below apply to all three.
Enable Turns the slot on or off. A disabled slot does not plot, does not contribute to the blend, and does not fire alerts. Disable any slot you are not using leaving unused slots enabled dilutes the blended output with readings you are not monitoring.
Hide Plot Removes the slot's RSI line from the chart, but the slot still contributes to the blend and fires alerts. Useful when you want a slot's weight in the composite without the visual clutter. Easy to forget that a hidden slot is still shaping the blended reading.
Source The price series fed to the RSI calculation. Default: close. Alternatives like hlc3 or ohlc4 smooth the input different price series produce different momentum readings for the same market.
TimeFrame The higher timeframe whose price data feeds this slot's RSI. Defaults: 5 / 15 / 60. Must be greater than or equal to the chart timeframe. Violation produces a runtime error, not a silent failure.
RSI Length Lookback period for the raw RSI calculation. Default: 14. This is the bedrock parameter it sets how many bars of gain-versus-loss history RSI considers. Shorter lengths produce a more reactive oscillator that whips faster with recent price changes. Longer lengths smooth the reading at the cost of speed. RSI(14) is the standard most traders already know. Moving it changes the character of the read, not just the speed.
RSI Smoothing Length of the moving average applied to raw RSI to produce the slot's RSI line. Default: 3. This is the first of two smoothing layers on top of the RSI lookback. Shorter preserves more of the raw signal's responsiveness. Longer reduces noise but adds lag. At length 1, this pass is effectively a bypass the RSI line tracks the raw RSI value.
RSI Type The moving average algorithm used for RSI Smoothing. Default: SMA. Options include every type in the Axiom Lite MA Library SMA, EMA, WMA, ALMA, and others. If you select ALMA, the global ALMA Offset and Sigma parameters apply.
Signal Length Length of the moving average applied to the smoothed RSI to produce the Signal line. Default: 3. This is the second smoothing layer. Shorter values produce faster regime transitions and more crossovers. Longer values reduce crossover frequency but delay regime change detection. Very short signal lengths on choppy instruments produce frequent whipsaw crossovers.
Signal Type The MA algorithm for the Signal line. Default: SMA. Same options and considerations as RSI Type.
Blended Weight This slot's relative contribution to the weighted composite. Default: 33.3 per slot. Weights auto-normalize across enabled slots, so only the ratios matter. Setting a weight to 0 keeps the slot's plot and alerts active but removes it from the blend that is intentional, not a bug. A note on what you are blending: RSI readings from instruments or timeframes that have no structural relationship will still produce a composite number. The math runs regardless. Whether that number is useful depends on whether the combination serves your analysis.
Optional Ticker Overrides the chart symbol for this slot. Leave empty to use the chart ticker. RSI is already bounded, and the bipolar conversion keeps cross-ticker readings on the same scale, so cross-instrument comparison works without additional normalization. Choose tickers where the RSI calculation has enough volume and price movement to be meaningful low-volume or delisted symbols produce erratic RSI behavior.
Line Width Visual thickness of the slot's RSI line. Preference only.
Global settings
Overbought Level Upper reference line and alert threshold on the bipolar scale. Default: +70. On the bipolar scale, +70 corresponds to a standard RSI of 85 considerably more extreme than the 70 level most traders use as overbought on a standard RSI chart. Adjust to match your own definition of extreme momentum.
Oversold Level Lower reference line and alert threshold. Default: -70. On the bipolar scale, -70 corresponds to a standard RSI of 15, more extreme than the usual 30 oversold level. Same adjustment logic applies.
Plot Blended RSI/Signal Shows or hides the composite RSI and Signal lines and their fill. Default: on. Disable when you only want individual slot readings.
Blended Line Width Thickness of the blended RSI and Signal lines. Default: 3.
Enable Master Smoothing - Applies a final MA pass to the blended RSI and Signal after weighting. Default: off. When the blended output is noisier than you want, master smoothing calms it down. The cost is real: it does not change the individual slot plots, but it does push the blended outputs further behind live price.
Master MA Type The MA algorithm for master smoothing. Default: EMA.
Master Length Lookback for master smoothing. Default: 3.
On Bar Close? The repaint control. Default: on. When enabled, each slot uses the last confirmed higher-timeframe value via a bar offset, and historical readings do not change after the fact. When disabled, slot output uses the current building bar and updates as new intrabar data arrives values will shift until the HTF bar closes. This is a user choice, labeled clearly. Toggle it on a live chart to see the behavior firsthand.
ALMA Offset / ALMA Sigma / ALMA Floor Offset Shared parameters that apply whenever ALMA is selected as an MA type anywhere in the indicator. Defaults: 0.85 / 6.0 / off. If no ALMA is active, these have no effect.
Alerts
18 alert conditions. Every one requires a confirmed bar before firing.
Per-slot alerts (9 total 3 per slot)
| Alert | Fires when |
|---|---|
| RSI 01 / 02 / 03 Is Bullish | Slot enabled, RSI > Signal, bar confirmed |
| RSI 01 / 02 / 03 Is Bearish | Slot enabled, RSI < Signal, bar confirmed |
| RSI 01 / 02 / 03 Regime Flip | Slot enabled, regime changed on this bar, bar confirmed |
Blended alerts (7 total)
| Alert | Fires when |
|---|---|
| Blended RSI Is Bullish | Blended RSI > blended Signal, bar confirmed |
| Blended RSI Is Bearish | Blended RSI < blended Signal, bar confirmed |
| Blended RSI Regime Flip | Blended regime changed on this bar, bar confirmed |
| Blended RSI Crossed Above Zero | Blended RSI crossed above 0, bar confirmed |
| Blended RSI Crossed Below Zero | Blended RSI crossed below 0, bar confirmed |
| Blended RSI Overbought | Blended RSI crossed above the overbought level, bar confirmed |
| Blended RSI Oversold | Blended RSI crossed below the oversold level, bar confirmed |
Alignment alerts (2 total)
| Alert | Fires when |
|---|---|
| All RSI Slots Bullish | Every enabled slot has RSI > Signal simultaneously, bar confirmed |
| All RSI Slots Bearish | Every enabled slot has RSI < Signal simultaneously, bar confirmed |
Behavior note: The Bullish and Bearish regime alerts fire on every confirmed bar where the condition holds not only on transitions. Regime Flip fires only on the bar where the state actually changes. For most use cases, set the TradingView alert frequency to "Once Per Bar Close."
FAQ
Does this indicator repaint? When On Bar Close is enabled which it is by default no. Each slot uses the last confirmed higher-timeframe value, and historical readings stay put. When On Bar Close is off, the output tracks the current building bar and changes as new data arrives. That is repainting by design, and it stops when the higher-timeframe bar closes. You can see the difference on any live chart: toggle the setting off, watch the values shift mid-bar, then toggle it back on and confirm they lock.
How is this different from a standard RSI indicator? It starts with the same RSI calculation the ratio of average gains to average losses over a lookback period. Then it smooths that raw RSI through a configurable moving average, derives a Signal line from a second smoothing pass, and shifts the range from 0–100 to -100/+100 centered on zero. Positive values mean buying pressure has been outpacing selling pressure over the lookback. Negative values mean the reverse. The conversion is linear an RSI of 75 maps to +50, an RSI of 25 maps to -50. No compression, no saturation curve. The practical difference is that zero becomes a meaningful neutral instead of 50, which makes multi-slot blending intuitive and regime shifts readable at a glance.
Does multi-timeframe RSI alignment mean the reading is more reliable? Alignment means every configured slot currently shows the same regime all bullish or all bearish. That is a factual observation about the present state of those RSI calculations. It does not mean the regime will hold on the next bar. Three timeframes showing bullish RSI simultaneously tells you where momentum sits right now across those timeframes. It tells you nothing about what comes next.
Can I blend RSI readings from different tickers? Yes. RSI is already bounded between 0 and 100, and the bipolar conversion keeps all slots on the same -100/+100 scale regardless of the underlying instrument. Cross-ticker blending is mathematically clean. Whether it is analytically useful depends on whether the instruments have a relationship that matters to your process. The oscillator keeps the readings comparable. Whether the combination tells you something useful is an analytical question, not a mathematical one.
How does smoothing affect how fast this responds? RSI Length shapes the raw RSI itself. RSI Smoothing slows the plotted slot RSI line. Signal Smoothing slows the internal Signal line, which means regime flips and the blended Signal react later even when the slot plot itself has not moved much. If you enable Master Smoothing, the blended RSI and blended Signal get another MA pass after weighting. The lag compounds, just not in one simple straight line.
Limitations
Smoothing creates lag that compounds. The RSI lookback already slows the raw calculation. RSI Smoothing delays the plotted slot RSI. Signal Smoothing delays the internal Signal path that drives regime logic and the blended Signal. Enable master smoothing and the blended outputs get delayed again after weighting. The cleaner the display looks, the more important it is to ask how much of that calm is just lateness.
The blend cannot distinguish agreement from dominance. A bullish blended RSI might mean all three slots turned bullish together. It might mean one heavily weighted slot dragged the composite while the others sat near neutral. The blend averages. If the distinction matters to your decision, check the individual slot lines.
RSI measures gain-to-loss ratios, not price direction. RSI calculates the proportion of average gains to average losses over a lookback period. A bullish RSI read means gains have been outpacing losses recently. It does not mean price is currently rising, and it does not forecast which direction price moves next.
Extreme values can persist. A reading near +100 or -100 on the bipolar scale means RSI is near its bounds. During strong, sustained trends, RSI can stay at elevated or depressed levels for extended periods without reversing. The overbought and oversold reference lines mark zones within the bounded range. They are not reversal signals.
Running identical slots adds nothing. Three slots set to the same timeframe, ticker, and settings produce three identical lines and a blend that equals any one of them. The oscillator does not flag this. If the slots are not configured to give you meaningfully different RSI reads, the multi-timeframe architecture is not doing anything for your analysis.
Support and training
Questions, feedback, and training resources are available through the AxiomCharts website.
Disclaimer
This indicator is an analytical tool, not financial advice. It does not generate trade signals, recommend positions, or guarantee outcomes of any kind. All trading involves risk, including the possibility of loss. Past behavior of any indicator does not predict future results. Use this tool as one component of a broader process and always apply your own judgment and risk management.
Free access
Read everything on this page first. Open it on TradingView only when you are clear on what it does and what it does not do.
Open in TradingViewRelated products
If this one is close but not quite right, there may be a better fit nearby for the same kind of chart work, testing need, or workflow gap.
Keep looking
If this one is close but not quite right, there may be a better fit nearby for the same kind of chart work, testing need, or workflow gap.
Find your starting pointWeighing a few options against each other?
Tell us what you are trying to accomplish and we will help you narrow it down honestly.