indicator | Oscillators / RSI / Momentum
Axiom RSI Osc Pro
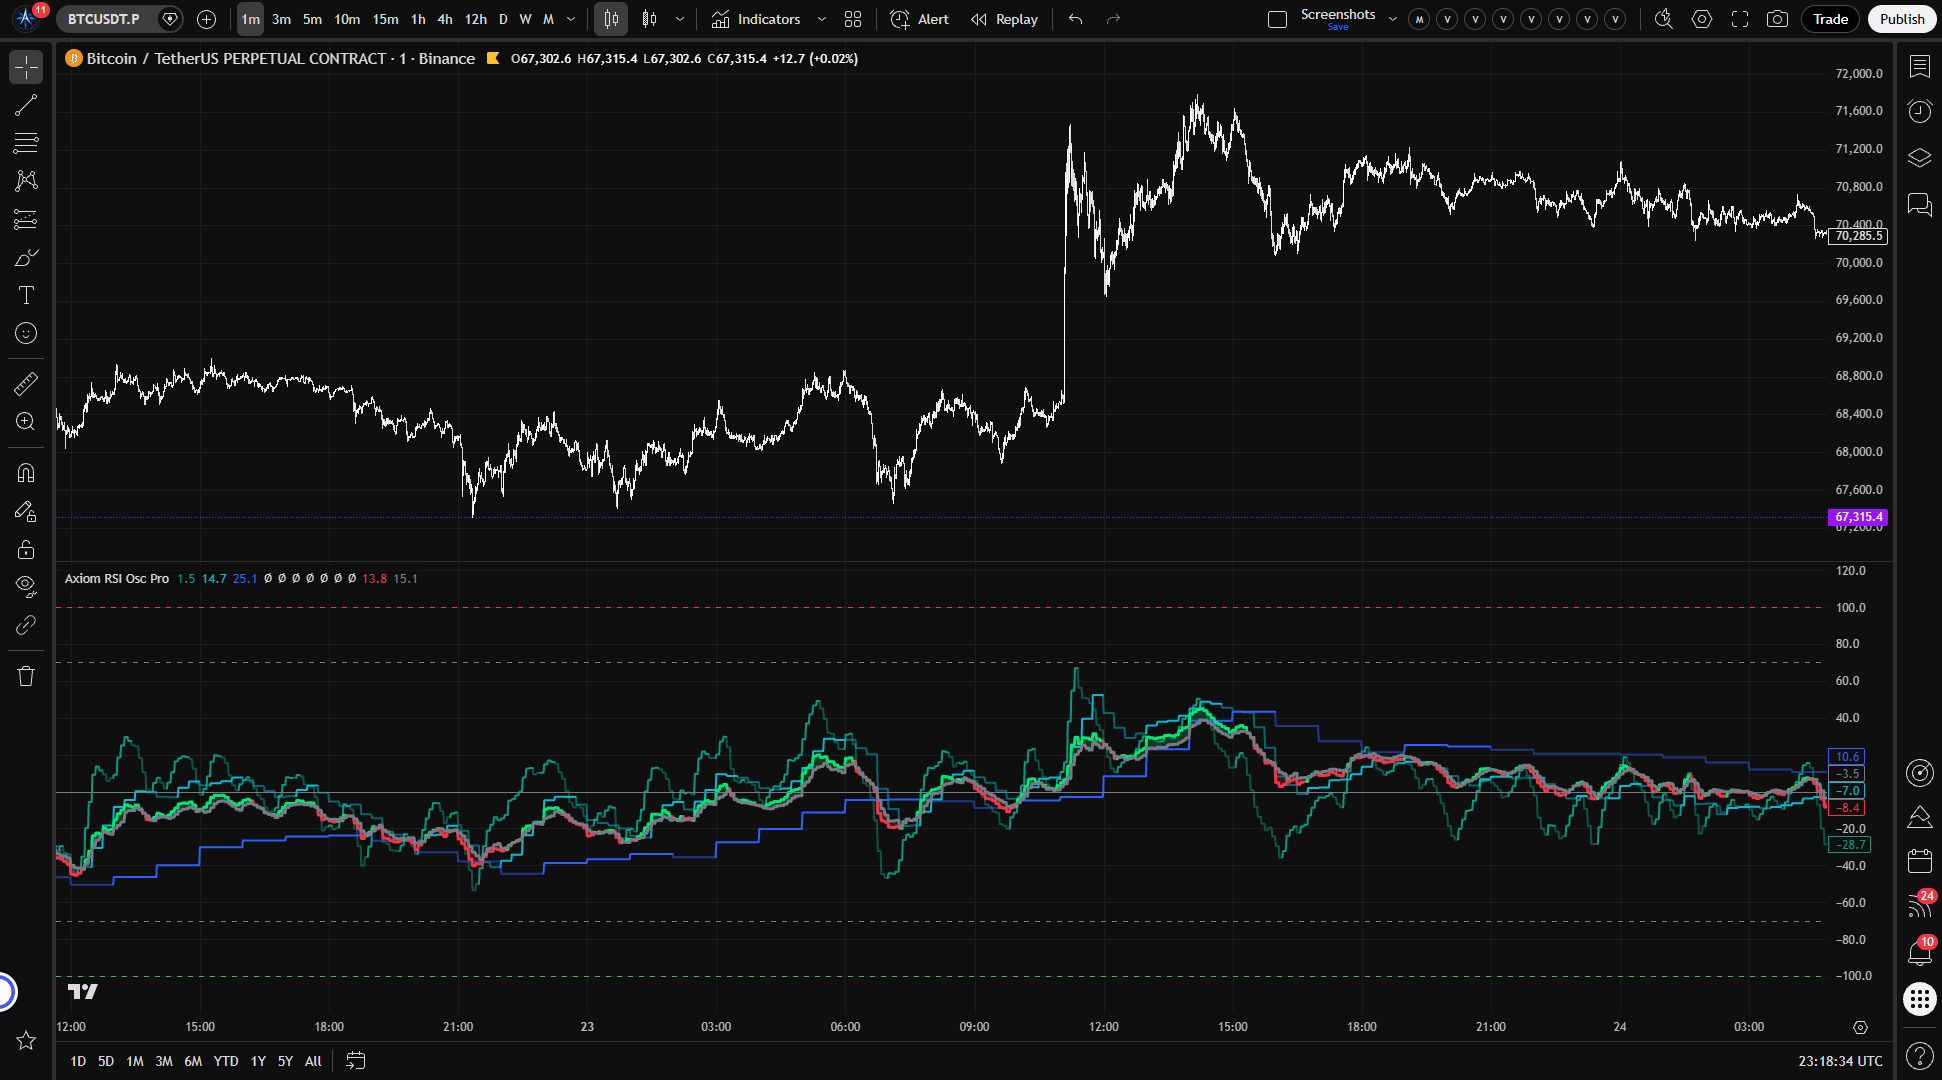
Axiom RSI Osc Pro runs up to ten RSI calculations in one oscillator pane, with per-slot timeframe, ticker, smoothing, and repaint control. It is built for traders who already use RSI as process and want faster multi-timeframe comparison without building custom tooling or trusting hidden defaults.
Last updated: Apr 4, 2026
Crypto / Futures / Stocks / Forex / Indices | 1m / 5m / 15m / 1H / 4H / 1D
Best-fit markets
Primary timeframes
Product details
Explore the details to see whether the tool fits the problem you are trying to solve for.
Axiom RSI Osc Pro
Overview
If you check RSI across multiple timeframes, you already know the routine. Open a chart. Tile another beside it. Switch timeframes. Try to hold three or four readings in your head long enough to compare them. Do that on every setup and the minutes add up fast.
The other option is a multi-timeframe indicator — but most of them don't tell you whether they repaint, how they blend their data, or what tradeoffs their defaults impose.
Axiom RSI Osc Pro runs up to 10 independent RSI calculations in a single oscillator pane. Each slot gets its own timeframe, its own optional ticker symbol, its own smoothing configuration, and its own repaint toggle. You decide which timeframes matter, how much weight each one carries in the blended output, and whether each slot prioritizes speed or stability.
Who this is for: Traders who already use RSI as part of their process and want to see momentum agreement or disagreement across timeframes — or across symbols — without building a custom script or tiling charts.
Who this is not for: If you want a plug-and-play entry signal, if you don't use RSI in your analysis, or if you need a backtestable strategy with entries and exits, this is not the right tool. If you expect the blended output to be smarter than the individual readings behind it, read the limitations before you start configuring.
Before you start reading values, know that this indicator does not use the standard 0–100 RSI scale. It maps RSI to a bipolar -100 to +100 range centered at zero. Positive means above-midpoint momentum; negative means below. If you normally watch standard RSI at 30 and 70, those familiar levels map to -40 and +40 here. The default OB/OS lines sit wider at -70 and +70, which corresponds to a much more extreme standard RSI reading.
Why this matters: Every minute spent manually comparing RSI across timeframes is a minute not spent on the actual decision. But saving that time by trusting a tool that hides its repainting behavior just moves the cost somewhere worse — from your schedule to your account. This indicator makes the repaint tradeoff a per-slot choice you control with a single toggle. Each slot's stability behavior is visible in its settings, not buried in the implementation.
Features
10 independent RSI slots Each slot is a self-contained RSI calculation with its own timeframe, price source, optional ticker override, smoothing settings, and blend weight. Enable as many or as few as your methodology requires. Slots 01 through 03 are active by default at 5-minute, 15-minute, and 60-minute timeframes.
Per-slot timeframe and ticker Every slot can target a different timeframe and, optionally, a different symbol. Run one slot on 15-minute ES, another on 60-minute NQ, and a third on daily SPY — all in the same pane. Slot timeframes must be at or above the chart timeframe; the script enforces this with a runtime error if violated.
Dual-layer smoothing via Axiom MA Library Each slot applies two stages of moving-average smoothing: one to the raw RSI calculation, and a second to produce the Signal line. Both layers support multiple MA types — SMA, EMA, ALMA, KAMA, FRAMA, Jurik, Laguerre, and VAMA — so you can shape the RSI line's character independently from the Signal line's responsiveness.
Bipolar -100 to +100 oscillator Instead of standard RSI's 0–100 range, every slot outputs a zero-centered value. Positive readings mean momentum is above the midpoint; negative means below. Zero means neutral momentum — no mental math to locate the midpoint. It also keeps the blended output centered around zero instead of around 50.
Weighted blended output Enabled slots blend into a single composite RSI and Signal pair. Weights auto-normalize — you assign relative importance (e.g., 50/25/25) and the indicator adjusts regardless of how many slots are active. A slot with its weight set to zero still plots and fires alerts but stays out of the blend.
Optional master smoothing A final smoothing pass can be applied to the blended output when the composite reading is too noisy for your use case. This adds lag in exchange for a cleaner combined line.
Regime color coding Each slot's plot line shifts between bright and faded color to show regime state: bright when the slot's RSI is above its Signal (bullish), faded when below (bearish). You get a directional read at a glance without checking exact numbers.
Per-slot repaint toggle The "On Bar Close?" switch in each slot's Power User section controls whether that slot uses confirmed higher-timeframe values (stable, with one bar of HTF lag) or live building-bar values (faster, but the reading can change until the higher-timeframe bar closes). Default is confirmed-bar mode.
39 bar-close-gated alert conditions Every alert — per-slot regime detection, blended regime and level crossings, all-slot alignment checks — fires only on confirmed bar close. No intrabar noise in your alert feed.
How to use
- Add the indicator to a chart on a lower timeframe (5-minute or 15-minute works well for the default setup).
- Slots 01, 02, and 03 are enabled by default, targeting 5-minute, 15-minute, and 60-minute timeframes with equal blend weights.
- Confirm that the blended RSI and Signal lines appear as the thicker lines in the oscillator pane, with colored fill between them.
- Verify that each active slot's individual RSI line appears in its assigned color.
- Check that "On Bar Close?" is enabled in the Power User section for each active slot — this is the default, meaning each slot uses confirmed higher-timeframe values.
What correct first use looks like: Three colored lines (one per active slot) in the oscillator pane, plus a thicker blended RSI/Signal pair with fill. When all three slot lines show bright color (bullish regime), the blended RSI should sit above its Signal line. Lines move in smooth steps, updating once per bar close — not continuous motion.
Key operating rule: Every slot's timeframe must be equal to or higher than the chart timeframe. Setting a slot below the chart timeframe produces a runtime error. This is a safety check — it prevents a class of silent misconfiguration in multi-timeframe data handling.
Settings
Per-slot settings (RSI 01 through RSI 10)
| Setting | Default | What it changes | When to adjust |
|---|---|---|---|
| Enable RSI XX | Slots 01–03: on; 04–10: off | Whether the slot computes, plots, and contributes to blending and alerts | Enable more slots when your methodology calls for additional timeframes or symbols |
| Hide RSI XX Plot | Off | Hides the slot's individual line; the slot still contributes to the blend and fires alerts | When you want a slot's weight in the composite without visual clutter |
| Source | close | Price series used for the RSI calculation | When you want RSI on open, hl2, hlc3, or another series |
| TimeFrame | Slot 01: 5m, Slot 02: 15m, Slot 03: 60m; others: chart TF | Which timeframe the slot pulls data from | Match to the timeframes in your trading process |
| RSI Length | 14 | Lookback period for the raw RSI calculation | Shorter = faster and noisier; longer = smoother and slower |
| RSI Smoothing | 3 | Length of the first MA layer on raw RSI | Lower values stay closer to raw RSI; higher values add smoothing and lag |
| RSI Type | SMA | MA type for RSI smoothing (SMA, EMA, ALMA, KAMA, FRAMA, Jurik, Laguerre, VAMA) | When you want a different smoothing profile |
| Signal Length | 3 | Length of the second MA layer, producing the Signal line | Controls how quickly the Signal responds — affects regime flip sensitivity |
| Signal Type | SMA | MA type for Signal smoothing | Same considerations as RSI Type |
| Blended Weight | Slots 01–03: 33.3; others: 0.0 | How much this slot influences the blended output | Increase for timeframes you consider more important; set to 0 to exclude from blend while keeping the plot and alerts |
| Optional Ticker | empty (chart symbol) | Overrides the symbol this slot evaluates | When you want cross-market RSI in the same pane |
General settings
| Setting | Default | What it changes |
|---|---|---|
| Overbought Level | 70 | Position of the OB reference line and alert threshold on the -100/+100 scale |
| Oversold Level | -70 | Position of the OS reference line and alert threshold |
| Plot Blended RSI/Signal | On | Whether the composite lines and fill are drawn |
Master smoothing
| Setting | Default | What it changes |
|---|---|---|
| Enable Master Smoothing | Off | Applies a final MA pass to the blended output after slot-level blending |
| Master MA Type | EMA | MA type for the master pass |
| Master Length | 3 | Smoothing length — higher values produce a cleaner line with more lag |
Power User section
Each slot includes advanced MA parameters — ALMA Offset/Sigma, KAMA Fast/Slow, FRAMA Fast/Slow, Jurik Phase/Power, Laguerre Alpha, VAMA Volume Length — that take effect only when the corresponding MA type is selected for that slot's RSI or Signal smoothing. These are tuning controls for the specific MA algorithm you've chosen. They have no effect when a different MA type is active.
Alerts
All alert conditions fire only on confirmed bar close. Use "Once Per Bar Close" as the trigger setting in TradingView's alert dialog.
Per-slot alerts (available for each of RSI 01 through RSI 10)
| Alert | Fires when |
|---|---|
| RSI XX Is Bullish | Slot's RSI is above its Signal at bar close |
| RSI XX Is Bearish | Slot's RSI is below its Signal at bar close |
| RSI XX Regime Flip | Slot's bullish/bearish state changed from the previous bar |
Blended alerts
| Alert | Fires when |
|---|---|
| Blended RSI Is Bullish | Blended RSI is above Blended Signal at bar close |
| Blended RSI Is Bearish | Blended RSI is below Blended Signal at bar close |
| Blended RSI Regime Flip | Blended regime state changed from the previous bar |
| Blended RSI Crossed Above Zero | Blended RSI crossed above the zero line |
| Blended RSI Crossed Below Zero | Blended RSI crossed below the zero line |
| Blended RSI Overbought | Blended RSI crossed above the Overbought level |
| Blended RSI Oversold | Blended RSI crossed below the Oversold level |
Alignment alerts
| Alert | Fires when |
|---|---|
| All RSI Slots Bullish | Every enabled slot has RSI above Signal at bar close |
| All RSI Slots Bearish | Every enabled slot has RSI below Signal at bar close |
Total: 39 alert conditions (30 per-slot + 7 blended + 2 alignment).
For the geeks
This section covers where the indicator departs from textbook RSI behavior. None of it is required to use the tool, but if you want to know exactly where this diverges from standard RSI before you start relying on the readings, keep going.
Bipolar rescaling
Standard RSI lives on a 0–100 scale with 50 as the midpoint. This indicator converts that to -100 to +100 with zero at the center. The practical gain: when you see a negative value, you know immediately that momentum sits below the midpoint. On a standard RSI, you'd see "30" and have to subtract 50 in your head to locate it relative to neutral.
Zero-centering keeps the midpoint at zero, which makes the composite easier to read. The default overbought and oversold levels (+70 and -70) are not the bipolar version of standard RSI 70/30. On this scale, standard RSI 70/30 maps to +40/-40.
You can verify this yourself: when standard RSI reads 50, this oscillator reads 0. When standard RSI reads 75, you'll see approximately +50 here. When standard RSI reads 25, approximately -50.
Auto-normalizing weighted blend
With up to 10 slots that can be toggled independently, requiring weights to sum to exactly 100 would mean recalculating every time you enable or disable a slot. Instead, the blend treats your weights as relative proportions. If three slots carry weights of 50, 25, and 25, the blend resolves them to 50%, 25%, and 25% — regardless of the raw numbers. Disable the third slot and the remaining two adjust automatically to roughly 67% and 33%.
A slot with its weight set to zero is excluded from the blend entirely but still plots on the chart and fires its alerts. This lets you monitor a timeframe visually without it influencing the composite reading.
To verify: enable two slots with equal weights and confirm the blended line sits between them. Set one weight to zero. The blend should now track the remaining slot exactly.
Dual-layer smoothing
Each slot applies two separate moving averages in sequence. The first smooths the raw RSI — this shapes how the RSI line itself behaves (noisier or calmer). The second smooths that result to produce the Signal line — this controls how quickly regime flips happen (where the RSI line crosses above or below Signal).
The two layers are independent. A fast RSI line paired with a slow Signal line produces fewer regime flips, but each one carries more weight. A smooth RSI line paired with a tight Signal line detects regime changes more frequently, but each flip is less decisive. The interaction between those two choices — not either one alone — determines how the slot responds to momentum shifts.
How "On Bar Close?" works
Each slot pulls data from its target timeframe using TradingView's multi-timeframe data system. The "On Bar Close?" toggle controls which version of that data the slot sees:
- On (default): The slot reads the last fully confirmed value from the higher timeframe. The RSI line updates in steps — it holds steady until the next higher-timeframe bar closes, then jumps to the new value. The tradeoff is one bar of lag on the higher timeframe. What you see in chart history is exactly what was available in real time.
- Off: The slot reads the currently building higher-timeframe bar. The RSI line updates more fluidly as new price data arrives, but the value can change until that bar closes. Historical bars show the final value, which may not match what appeared on screen while that bar was still forming.
Both modes are legitimate choices. The default favors stability. Turning it off favors responsiveness. The important thing is that the choice is explicit and per-slot — not hidden behind a single global assumption.
FAQ
Why does this show -100 to +100 instead of standard RSI?
The indicator converts standard RSI to a zero-centered bipolar scale. Zero equals neutral (equivalent to RSI 50). Positive values mean above-midpoint momentum; negative means below. This keeps the center line and blended output anchored around zero. The default overbought and oversold levels (+70/-70) are more extreme than traditional RSI 70/30; if you want the familiar 70/30 zones, use +40/-40 here.
Does this indicator repaint?
That depends on how you configure each slot. By default, "On Bar Close?" is enabled for every slot, which means each slot uses confirmed higher-timeframe values. In that mode, the slot does not repaint intrabar on the higher timeframe — what you see in chart history is what was available in real time. If you disable "On Bar Close?" for a slot, that slot updates with the building higher-timeframe bar and its values can change until that bar closes. That is repainting by design, not a defect. The setting is yours to control, per slot.
How do the blend weights work? Do they need to add up to 100?
No. Weights auto-normalize. You assign relative importance — if three active slots carry weights of 50, 25, and 25, the blend resolves them proportionally regardless of the raw numbers. Disable a slot or set its weight to zero and the remaining slots adjust automatically. A zero-weight slot still plots and triggers alerts but does not influence the blended reading. Note that running multiple slots on closely spaced timeframes does not create stronger confluence — it creates redundancy.
Can I use this as a buy/sell signal?
No. This indicator summarizes momentum state across the timeframes and symbols you configure. It does not generate entries, exits, or trade recommendations. The blended RSI line is a weighted momentum summary, not an instruction to act. Whether a reading confirms your thesis, flags disagreement, or prompts further analysis is a decision only you can make.
What happens if I set a slot timeframe below my chart timeframe?
The script stops with a runtime error. This is intentional. Requesting lower-timeframe data through Pine's multi-timeframe system produces unreliable results, so the indicator blocks it rather than letting the misconfiguration fail quietly. Set the slot's timeframe to match or exceed the chart timeframe to resolve the error.
Limitations
-
This is not a signal generator. The indicator shows you what RSI is doing across your chosen timeframes. It does not produce entries, exits, or trade signals. The interpretation and the trading decision are yours.
-
The -100 to +100 scale is not standard RSI. If you watch standard RSI at 30 and 70, those familiar thresholds map to -40 and +40 here. The default +70/-70 lines are much more extreme, and smoothing can move the plotted value further from the raw RSI reading you may be used to.
-
Correlated timeframes create redundancy, not confluence. Running slots on 5-minute, 10-minute, and 15-minute charts of the same symbol measures roughly the same momentum regime three slightly different ways. Unanimous agreement across those slots feels like confirmation but carries less independent information than three widely spaced timeframes would.
-
Confirmed-bar mode introduces lag. With "On Bar Close?" enabled (the default), each slot lags by one higher-timeframe bar. That is the cost of stability — the reading will not change retroactively, but it also will not reflect the most current intrabar price action on the higher timeframe.
-
The blended line is a weighted average, not a verdict. It is not a more sophisticated synthesis than the individual slots that compose it. If most of your active slots target similar timeframes, the blend will tell you roughly what any one of those slots already showed you.
-
Cross-ticker slots may behave unexpectedly. Symbols with different trading sessions, holidays, or data availability can produce gaps or timing mismatches in the oscillator. Verify cross-ticker setups on your specific symbols before depending on them.
-
No strategy or backtest capability. This is an indicator. It cannot generate backtest results, trade simulations, or performance statistics.
Support and training
For questions, documentation, and training resources, visit the AxiomCharts website.
Disclaimer
This indicator is provided for educational and informational purposes only. It does not constitute financial advice, a trading recommendation, or a solicitation to buy or sell any financial instrument. Past performance of any trading methodology or indicator is not indicative of future results. Trading involves significant risk of loss and is not suitable for all investors. You are solely responsible for your own trading decisions. Use this tool as one component of your own research and analysis, not as a substitute for independent judgment.
Related products
If this one is close but not quite right, there may be a better fit nearby for the same kind of chart work, testing need, or workflow gap.
Keep looking
If this one is close but not quite right, there may be a better fit nearby for the same kind of chart work, testing need, or workflow gap.
Find your starting pointWeighing a few options against each other?
Tell us what you are trying to accomplish and we will help you narrow it down honestly.