indicator | Oscillators / Stochastic / Range Position
Axiom Stoch Osc Lite
Axiom Stoch Osc Lite runs up to three stochastic slots, converts the output to a zero-centered scale, and blends enabled slots into one weighted read of range-position momentum. It is for traders who already use stochastics across timeframes and want clarity about repaint behavior instead of another black-box shortcut.
Last updated: Apr 4, 2026
Crypto / Futures / Stocks / Forex / Indices | 1m / 5m / 15m / 1H / 4H / 1D
Best-fit markets
Primary timeframes
Product details
Explore the details to see whether the tool fits the problem you are trying to solve for.
Axiom Stoch Osc Lite
Overview
You already know what the Stochastic oscillator tells you — where price closed relative to its recent high-low range. That reading matters on one timeframe. It matters more when you can check whether the 5-minute stochastic agrees with the hourly. The problem is that making that comparison across separate chart panes means the shorter-timeframe picture has already moved by the time you finish looking.
Axiom Stoch Osc Lite runs up to three independent stochastic calculations in a single oscillator pane. Each slot computes standard %K against its own configurable timeframe, source, and optional ticker symbol. Output sits on a –100/+100 axis centered on zero instead of the familiar 0–100 range. Positive means the close is in the upper half of the lookback range. Negative means the lower half. Enabled slots feed into a weighted blend that produces composite K and D lines — one summary read across whatever timeframes or instruments you chose to stack.
Does not repaint when On Bar Close is enabled, which is the default. With On Bar Close off, slot values update live as the higher-timeframe bar builds and change until that bar closes — that is a deliberate mode, not a defect.
Why this matters
The useful question with the stochastic is almost never about one timeframe alone. It is comparative: does the entry-timeframe reading hold up when you check the next timeframe up? That comparison carries weight only when it happens at the same moment. Flip between three chart panes to find out and the shorter timeframe has already moved by the time you get back. Stacking those reads on a shared bounded axis does not make the stochastic more predictive. It makes the comparison current — which is the only state in which it means anything.
Who this is for
Someone who uses the stochastic to gauge where price sits within its recent range and wants to layer that read across timeframes — or across tickers — without running separate indicators on separate panes. Someone comfortable picking K lengths, smoothing types, and blend weights that match their own analytical process. Someone who cares whether higher-timeframe stochastic values come from a confirmed bar or a bar that is still building.
This is not for someone expecting an indicator that generates entries when the stochastic crosses a threshold. Not for someone who treats multi-timeframe overbought readings as a reversal forecast. And not for someone who wants raw, unsmoothed %K — every slot applies at least one smoothing pass to raw %K before output.
What to calibrate before you trust the output
Smoothing compounds. K Length sets the stochastic lookback window. After that, each slot applies one MA pass to raw %K to produce K, then a second MA pass to produce D. With the defaults — K Length 14, K Smoothing SMA(3), D SMA(3) — the K line already lags raw price action, and D lags further. The lookback and the smoothing chain both slow the reading down, and the delay adds up.
The blend averages — it does not validate. A bullish blended K line does not mean all three slots agree that the close is near the top of the range. It means the weight-adjusted composite landed above the weight-adjusted D. One heavily weighted slot at +90 can pull the blend bullish while the other two sit near zero.
Features
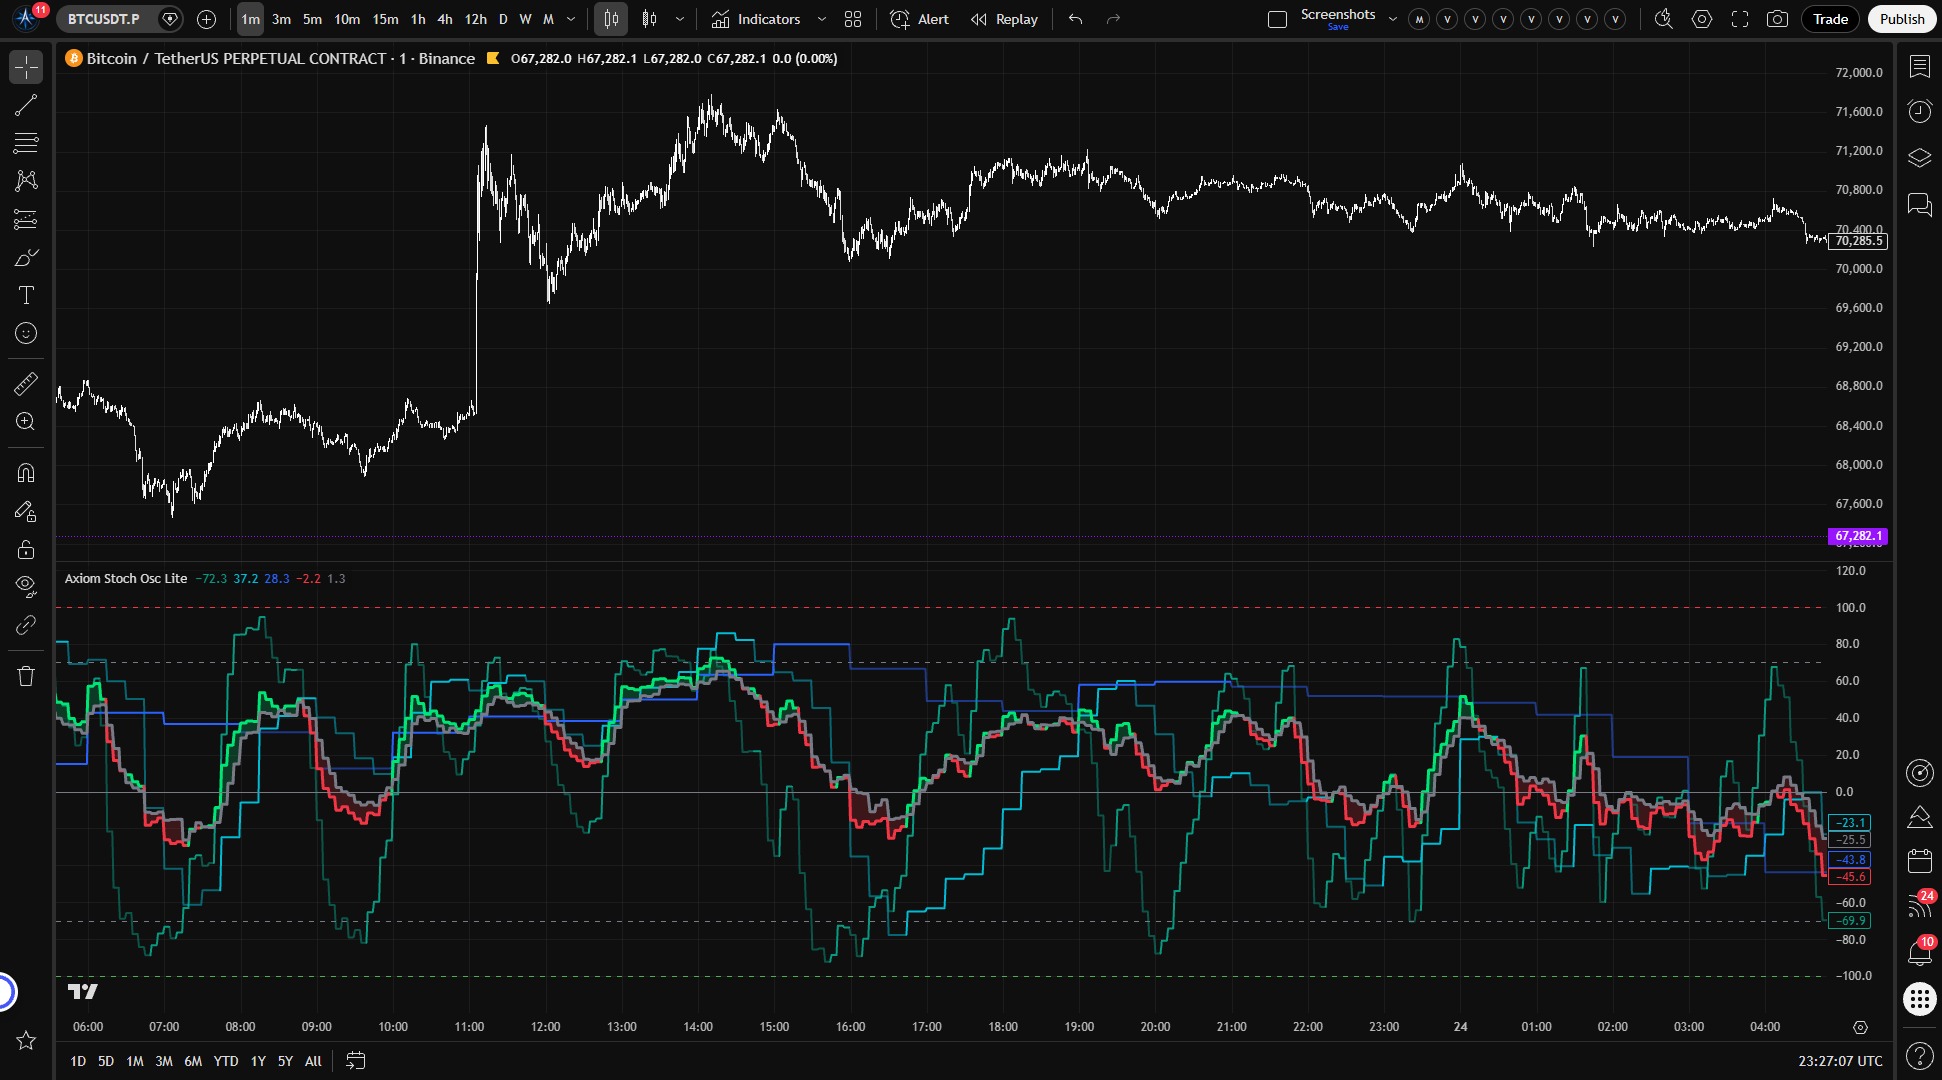
Slot K lines (up to 3) — Each enabled slot plots its own smoothed stochastic K line on the bipolar scale, colored by regime: one tint when K is above D, another when K falls below. Individual timeframe range-position reads, side by side on the same bounded axis.
Blended K line — A weight-normalized composite K across all enabled slots. One summary of range-position behavior for the timeframe or ticker stack you configured. Weights auto-normalize, so they do not need to sum to any particular number.
Blended D line — A weight-normalized composite D that serves as the regime reference for the blend. Blended K above D marks bullish regime. Below marks bearish.
K/D fill — Shaded region between blended K and blended D. Widening fill reflects growing separation between the composite and its reference. Color shifts with the regime direction.
Reference lines — Five horizontal lines: –100, the oversold level, zero, the overbought level, and +100. Default overbought and oversold sit at +70 and –70, which map to 85 and 15 on a standard 0–100 stochastic scale — more extreme than the traditional 80/20 thresholds.
How to use
- Add to chart. A lower-timeframe chart (1-minute or 5-minute) works well for initial verification, since the default slot timeframes are 5m, 15m, and 60m.
- Check the defaults. Three stochastic slots are enabled: Stoch 01 at 5m, Stoch 02 at 15m, Stoch 03 at 60m. Each uses K Length 14, SMA(3) for K Smoothing, SMA(3) for D, and equal blend weights of 33.3. On Bar Close is enabled.
- Confirm the visual. Three slot K lines (teal, aqua, blue) should appear in the oscillator pane, along with a blended K line (lime when bullish, red when bearish), a gray blended D line, and translucent fill between them. All output stays within –100 to +100.
- Test the repaint switch. Toggle On Bar Close off. Slot values should begin updating in real time as the current bar builds. Toggle it back on — values freeze at the last confirmed higher-timeframe bar. If the output does not change when toggling, check that the chart timeframe is shorter than the slot timeframes.
- Watch the slot cadence. The 60m slot should move in larger steps and update less frequently than the 5m slot. That is expected — it is reading stochastic data from a timeframe where bars close less often.
Settings
Per-slot settings (Stoch 01, Stoch 02, Stoch 03)
Each slot uses the same configuration structure.
Enable — Whether the slot runs, plots, feeds the blend, and fires alerts. Disable any slot you are not actively using. Leaving an unused slot enabled dilutes the blended output with a stochastic reading you are not monitoring.
Hide Plot — Removes the slot's K line from the chart without removing it from the blend or disabling its alerts. Useful when you want a slot's weight in the composite without the visual noise. Keep in mind that a hidden slot still shapes the blended reading.
Source — The price series used as the "close" input for the stochastic formula. Default: close. Alternatives like hlc3 or ohlc4 produce a smoother input. The high and low of the stochastic range always use the actual bar high and low regardless of this setting — changing the source changes where within the high-low range the selected value falls, not the range itself.
TimeFrame — The timeframe whose price data feeds this slot's stochastic. Defaults: 5m (Slot 01), 15m (Slot 02), 60m (Slot 03). Must be equal to or greater than the chart timeframe. The script enforces this with a runtime error, not a silent fallback.
K Length — The lookback period for raw %K — how many bars of high, low, and source data define the range that the close is measured against. Default: 14. Shorter values create a tighter range window that reacts faster. Longer values widen the window and smooth out narrow-range noise. This is not the same parameter as K Smoothing. K Length defines the range. K Smoothing smooths the reading after it has been computed.
K Smoothing — The length of the moving average applied to raw %K to produce the slot's K line. Default: 3. This is the first smoothing layer on top of the stochastic lookback. In traditional stochastic terminology, the output after this step is roughly equivalent to "slow %K." Shorter values preserve more of raw %K's responsiveness. Longer values add lag but reduce chop.
K Type — The moving average algorithm used for K Smoothing. Default: SMA. Any MA type in the Axiom Lite MA Library is available. If you select ALMA, the global ALMA Offset and Sigma parameters apply.
D Length — The length of the moving average applied to smoothed K to produce the D line. Default: 3. This is the second smoothing layer — applied to a K value that has already been smoothed by K Smoothing. The lag compounds: the stochastic lookback sets the window, K Smoothing adds the first MA delay, and D adds the second. With the defaults (14 / 3 / 3), the D line is materially slower than raw price action even before any master smoothing. Shorter D values produce faster K/D crossovers but more whipsaw on choppy instruments.
D Type — The moving average algorithm for D. Default: SMA. Same options and ALMA considerations as K Type.
Blended Weight — The slot's relative contribution to the blended composite. Default: 33.3. Weights auto-normalize across enabled slots. Setting a slot's weight to 0 removes it from the blend while keeping its plot and alerts active — that is intentional behavior. Weight toward the timeframes or instruments that carry the most analytical weight in your process. Be aware that a single high-weighted slot can dominate the composite even when the other slots point a different direction.
Optional Ticker — Overrides the chart symbol for this slot. Leave empty to use the chart's current symbol. Each slot can pull stochastic data from a different instrument — useful for watching related markets side by side. The stochastic is bounded, so the bipolar scale stays comparable across instruments. But blending stochastics from unrelated tickers produces a number without an analytical thesis behind it. Whether the composite is meaningful depends entirely on whether you have a reason to watch those instruments together.
Line Width — Visual thickness of the slot's K line. Preference only.
Global settings
Overbought Level — Upper reference line and alert threshold on the bipolar scale. Default: 70, which corresponds to 85 on a standard 0–100 stochastic — more extreme than the traditional 80/20 threshold. Tighten for stricter extreme zones, widen for broader bands.
Oversold Level — Lower reference line and alert threshold. Default: –70, which corresponds to 15 on the standard scale.
Plot Blended K/D — Whether the composite K and D lines and the fill between them appear on the chart. Disable when you only want individual slot reads.
Blended Line Width — Thickness of the blended K and D lines. Preference only.
Enable Master Smoothing — Applies one more moving average pass to the blended K and D after weighting. Off by default. When enabled, this adds a third MA pass to the chain: K Smoothing is the first, D is the second, and master smoothing is the third. K Length still affects responsiveness, but it is the stochastic lookback window, not another MA layer. Use it when the blended output is noisier than you need, but understand that each added layer delays the reading further.
Master MA Type — Moving average algorithm for master smoothing. Default: EMA.
Master Length — Lookback for master smoothing. Default: 3.
On Bar Close? — The repaint control. Enabled by default.
- On (default): Each slot reads the last confirmed higher-timeframe value. Historical output does not change after the fact.
- Off: Slot output uses the building higher-timeframe bar and updates in real time as new data arrives. Values are not stable until the bar closes. This repaints by design.
You can verify the difference on a live chart by toggling this setting and watching the output change.
ALMA Offset / ALMA Sigma / ALMA Floor Offset? — Global ALMA parameters shared across all ALMA-type selections. Only relevant when ALMA is chosen as a K Type, D Type, or Master MA Type somewhere in the configuration. Defaults: 0.85 / 6.0 / off.
Alerts
Eighteen alert conditions, all gated to confirmed bars only. No alert fires until the bar closes.
Per-slot alerts (3 per slot, 9 total)
| Alert | Fires when |
|---|---|
| Stoch 01/02/03 Is Bullish | Slot enabled, K > D, bar confirmed |
| Stoch 01/02/03 Is Bearish | Slot enabled, K < D, bar confirmed |
| Stoch 01/02/03 Regime Flip | Slot enabled, bullish/bearish state changed on this bar, bar confirmed |
Blended alerts (7 total)
| Alert | Fires when |
|---|---|
| Blended Stoch Is Bullish | Blended K > blended D, bar confirmed |
| Blended Stoch Is Bearish | Blended K < blended D, bar confirmed |
| Blended Stoch Regime Flip | Blended regime changed on this bar, bar confirmed |
| Blended Stoch Crossed Above Zero | Blended K crossed above 0, bar confirmed |
| Blended Stoch Crossed Below Zero | Blended K crossed below 0, bar confirmed |
| Blended Stoch Overbought | Blended K crossed above the overbought level, bar confirmed |
| Blended Stoch Oversold | Blended K crossed below the oversold level, bar confirmed |
Alignment alerts (2 total)
| Alert | Fires when |
|---|---|
| All Stoch Slots Bullish | Every enabled slot has K > D simultaneously, bar confirmed |
| All Stoch Slots Bearish | Every enabled slot has K < D simultaneously, bar confirmed |
A note on frequency. The bullish and bearish regime alerts fire on every confirmed bar where the condition holds — not only on the bar where the regime started. Regime Flip fires only on the transition bar itself. For most setups, configure the TradingView alert frequency to "Once Per Bar Close."
FAQ
Does this indicator repaint?
With On Bar Close enabled — which is the default — no. Each slot reads the last confirmed higher-timeframe value, and historical output does not shift after the fact. With On Bar Close off, yes, by design. The output tracks the building higher-timeframe bar and updates as new data comes in until that bar closes. The toggle is there so you can choose which mode fits your workflow. You can verify it yourself: switch the setting on a live chart and watch the output move between confirmed and live behavior.
How is this different from a standard Stochastic indicator?
It starts with the same formula — where did the close fall between the highest high and lowest low over the lookback period. Three things change from there. First, the raw %K goes through a configurable moving average (K Smoothing) to produce K, and K goes through a second configurable MA to produce D — so the output carries more smoothing than a typical stochastic pane, and both smoothing types are selectable. Second, the 0–100 range is shifted to –100/+100 centered on zero, which means the default overbought and oversold levels (+/-70) map to 85 and 15 on the standard scale — more extreme than the traditional 80/20. Third, up to three of these calculations run independently on different timeframes or tickers and feed into a single weighted blend. The math inside each slot is standard stochastic. The difference is in how the outputs are smoothed, recentered, and composed.
How does this relate to "fast" and "slow" stochastic?
K Length computes the raw stochastic — what traditional terminology calls "fast %K." K Smoothing applies a moving average to that raw value, producing what is traditionally called "slow %K." D applies a further moving average to the smoothed K, filling the same role as the traditional %D signal line. The difference here is that both K and D smoothing types go beyond SMA — you can set EMA, ALMA, WMA, or any other type supported by the Axiom Lite MA Library.
Does multi-timeframe stochastic alignment mean a reversal is coming?
No. When all three slots show overbought readings at the same time, that means the close is currently near the top of the recent range on each of those timeframes. It describes where price is sitting now — not where it is heading. Stochastics can stay pinned near their bounds for extended stretches during strong trends, because price keeps closing near the top of the range in an uptrend and near the bottom in a downtrend. Three timeframes confirming that state does not increase the odds of a reversal. It increases your visibility into the current range position across a wider scope.
Can I blend stochastic readings from different tickers?
You can. Each slot accepts a ticker override, and the bipolar –100/+100 scale keeps the output comparable regardless of the underlying instrument's price. But whether the composite tells you something useful depends on the relationship between the instruments. Blending the stochastic of two instruments that move together — ES and SPY, for instance — has a structural logic. Blending two instruments with no meaningful connection produces a number that is bounded and zero-centered but carries no analytical weight. The tool lets you do either. It does not pretend the second case means something.
Limitations
Range position is not price direction. The Stochastic oscillator tells you where the close sits within the recent high-low range — not where price is heading or how likely a reversal is. Stacking three of those measurements on a shared axis makes the comparison easier to read. It does not make the reading more predictive.
Extreme values persist. In a sustained uptrend, price keeps closing near the top of its range, and the stochastic stays near +100 for as long as that continues. Overbought is a description of where the close sits relative to the range boundary, not a forecast that price has gone too far.
Smoothing delays the reading. Each slot's K line has been through at least two averaging passes (K Length plus K Smoothing), and D adds a third. Master smoothing, if enabled, adds a fourth. The lag is cumulative. Faster crossovers require shorter smoothing, which increases noise. That tradeoff exists in every smoothed oscillator. It is worth configuring deliberately rather than accepting defaults you have not thought through.
The blend cannot tell you whether the slots agree. A bullish blended K means the weighted composite sits above the weighted D. It does not distinguish between all three slots trending in the same direction and one dominant slot pulling the number while the others sit flat. When the blended regime matters to a decision, check the individual slot K lines.
Slot timeframes must be equal to or greater than the chart timeframe. The script enforces this with a runtime error. If you need a lower-timeframe stochastic read, switch to a lower chart timeframe.
Support and training
Questions, feedback, and training resources are available through the AxiomCharts website.
Disclaimer
This indicator is an analytical tool for educational and informational purposes. It does not constitute financial advice, and no part of its output should be interpreted as a recommendation to buy, sell, or hold any financial instrument. Trading involves substantial risk of loss. Past stochastic behavior does not indicate future price movement. Use this tool as one input within your own research and decision-making process, and consult a qualified financial professional before making trading decisions.
Free access
Read everything on this page first. Open it on TradingView only when you are clear on what it does and what it does not do.
Open in TradingViewRelated products
If this one is close but not quite right, there may be a better fit nearby for the same kind of chart work, testing need, or workflow gap.
Keep looking
If this one is close but not quite right, there may be a better fit nearby for the same kind of chart work, testing need, or workflow gap.
Find your starting pointWeighing a few options against each other?
Tell us what you are trying to accomplish and we will help you narrow it down honestly.