indicator | Oscillators / Stochastic / Range Position
Axiom Stoch Osc Pro
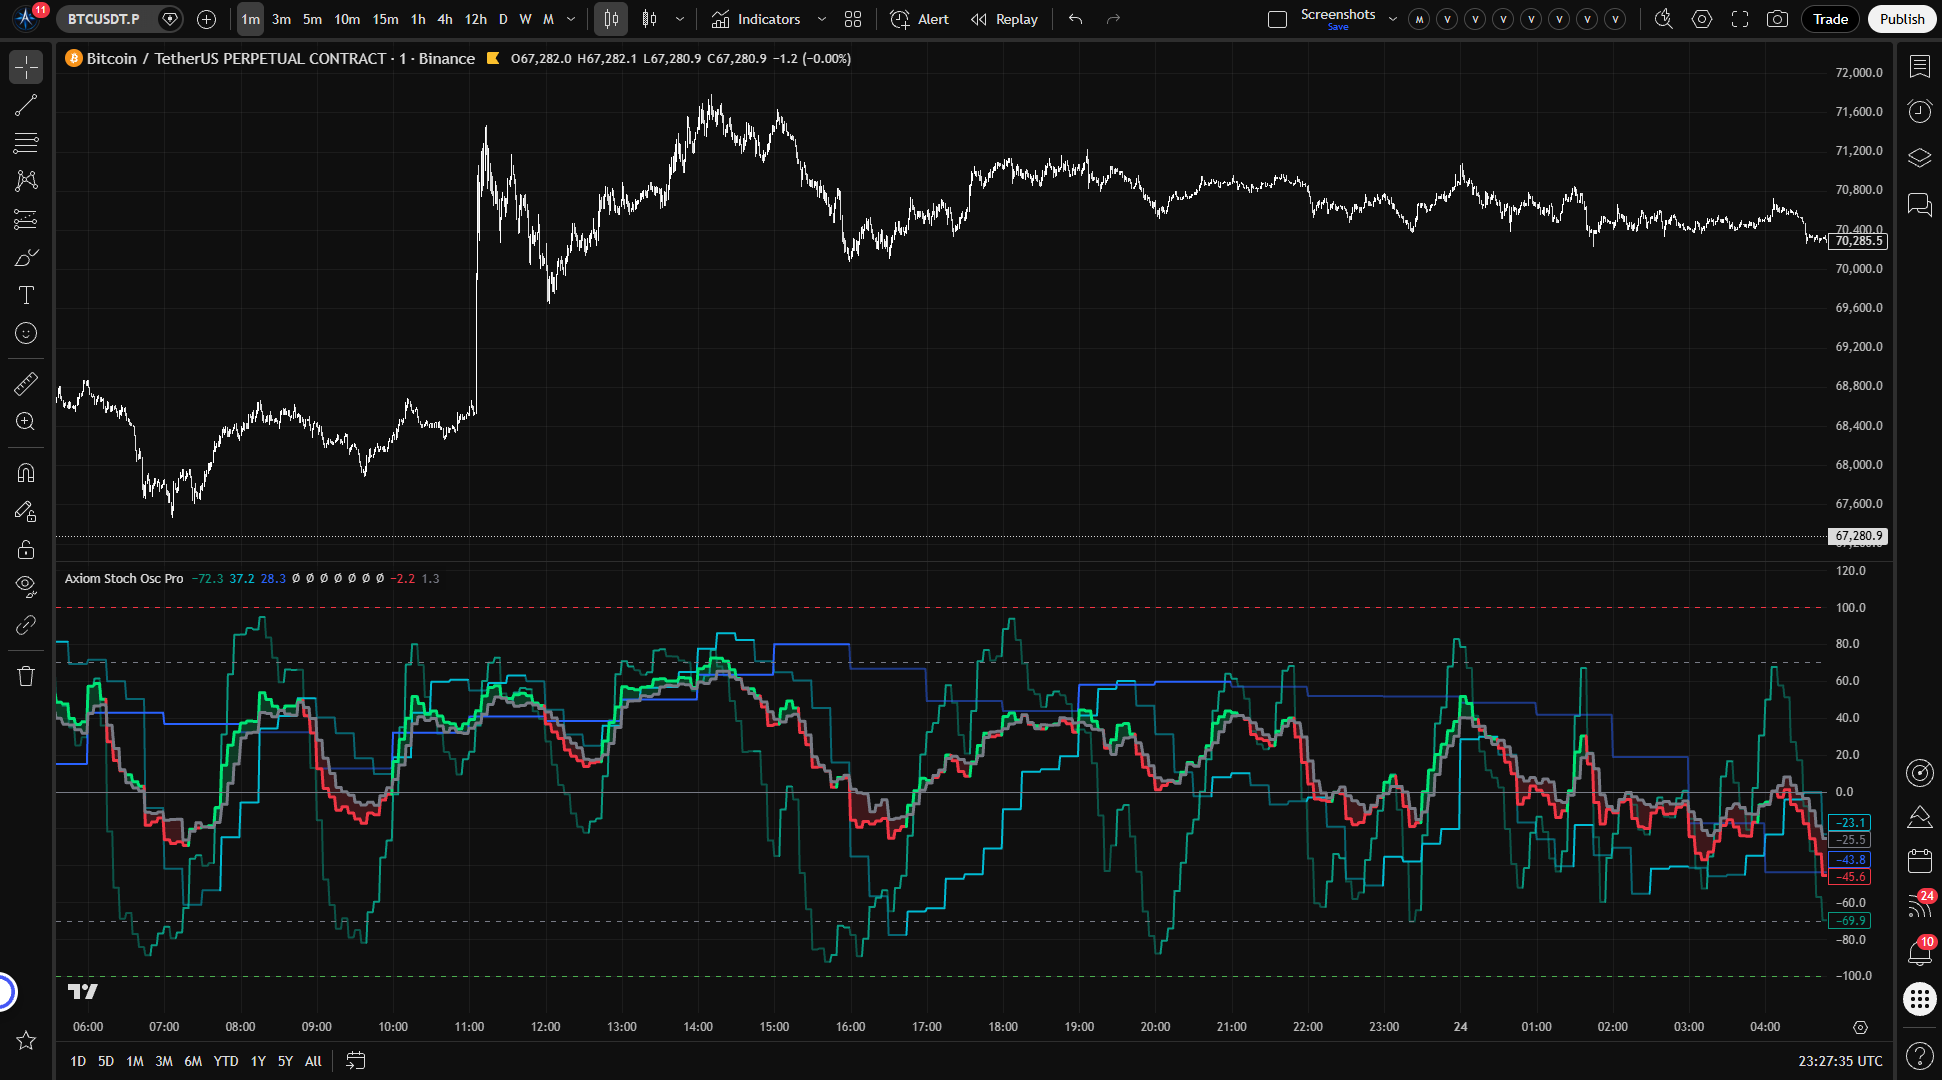
Axiom Stoch Osc Pro runs up to ten stochastic slots, supports per-slot timeframe and ticker control, and blends the active readings into one weighted oscillator view. It is built for traders who already use stochastics across timeframes and want faster, more honest comparison without another pile of separate panes.
Last updated: Apr 4, 2026
Crypto / Futures / Stocks / Forex / Indices | 1m / 5m / 15m / 1H / 4H / 1D
Best-fit markets
Primary timeframes
Product details
Explore the details to see whether the tool fits the problem you are trying to solve for.
Axiom Stoch Osc Pro
Overview
If you watch stochastic momentum on more than one timeframe, you already know the routine: separate oscillator instances, separate panes, and a lot of squinting between them to decide whether they actually agree. Axiom Stoch Osc Pro runs up to ten independent stochastic oscillators — each on its own timeframe, optionally its own ticker, with its own smoothing configuration — and blends them into a single weighted composite in one pane.
This is for traders who already work with stochastics across multiple timeframes. If you do not have that workflow today, a standard single-timeframe oscillator is simpler and more appropriate.
The indicator gives you per-slot control over repainting behavior — the safe default uses confirmed data only, explained in the settings below. The output reads on a -100 to +100 scale instead of the standard 0–100 range, so the numbers will look different from what you are used to. It helps you read momentum agreement in one place instead of across several panes. It does not tell you what to do with that reading.
Features
Per-slot stochastic independence Each of the ten slots runs its own stochastic calculation with its own timeframe, source, smoothing type, and lookback. You are not locked into one configuration across timeframes — each slot operates on its own terms.
Optional ticker override per slot Any slot can pull price data from a different symbol. If you want to watch momentum on an index alongside its futures contract, or compare a correlated pair, you can set that up per slot without adding another indicator.
Weighted composite blend Enabled slots blend into a single K and D line based on user-assigned weights. Weights auto-normalize across enabled slots, so you set relative importance rather than exact percentages. Setting a slot's weight to zero keeps its individual plot and alerts active but removes it from the composite.
Per-slot repaint control Every slot has its own "On Bar Close?" toggle. When enabled (the default), the slot reports only confirmed slot-timeframe data and does not repaint. When disabled, the slot updates intrabar for a faster read, but values will shift until that slot-timeframe bar closes. You choose the tradeoff per slot.
K and D smoothing from the Axiom MA Library Both K and D smoothing per slot can use any moving average type in the Axiom MA Library — standard choices like SMA and EMA plus specialized entries such as ALMA, KAMA, JMA/FRAMA/VAMA-style options, Laguerre, and others. Useful when your methodology calls for a specific smoothing behavior. SMA is the default and a reliable starting point.
Optional master smoothing After blending, you can run one more moving average pass over the composite K and D lines. This adds lag and is off by default. Most users will not need it.
39 alert conditions Per-slot regime alerts, blended regime and level alerts, and full-alignment alerts across all enabled slots. Every alert fires on confirmed bars only, regardless of the "On Bar Close?" setting on individual slots.
How to use
- Add the indicator to your chart.
- Confirm that your chart timeframe is equal to or lower than the lowest slot timeframe you plan to use. The defaults are 5-minute (slot 1), 15-minute (slot 2), and 1-hour (slot 3).
- Leave the three default slots enabled. They form a short, medium, and long momentum stack out of the box with equal weighting.
- Watch the individual slot K lines for per-timeframe momentum direction. Brighter color means K is above D (bullish regime); dimmer color means K is below D (bearish regime).
- Watch the blended K and D lines for the composite picture. The shaded fill between them makes the overall regime visible at a glance.
What correct first use looks like: three slot lines moving somewhat independently — because they track different timeframes — with a blended line that smooths across them. Color shifts should match what you would see if you opened three separate stochastic oscillators on those three timeframes. If the lines all move in lockstep, check that your slot timeframes are actually different from each other.
The blend is a quick agreement read, but it can smooth over real disagreement when weights are unbalanced or timeframes are closely spaced. Watch the individual slot lines alongside it.
Settings
Per-slot settings
Each of the ten slots has the same set of controls. Slots 1 through 3 are enabled by default; slots 4 through 10 are off.
Enable — turns the slot's calculation on or off. An enabled slot computes its stochastic, plots its line (unless hidden), participates in blending, and activates its alerts.
Hide Plot — removes the slot's line from the chart without removing it from the blend or alerts. Useful when you want a slot's influence in the composite but the chart is getting crowded. Remember: hidden slots still affect the blended reading.
Source — the price series fed into the stochastic calculation. Default is close. Change to hl2, hlc3, or another series when your methodology calls for it, but know that different sources change the oscillator's sensitivity.
Timeframe — the timeframe context for the slot's calculation. Slot 1 defaults to 5m, slot 2 to 15m, slot 3 to 1h, and slots 4–10 default to the chart timeframe. The slot timeframe must be equal to or higher than the chart timeframe — setting it lower produces a runtime error, and that is intentional.
K Length — lookback period for the raw %K calculation. Default is 14. Shorter lengths respond faster but produce more noise. Very short lengths on higher timeframes can generate whippy oscillations that are difficult to act on.
K Smoothing — length of the moving average applied to raw %K. Default is 3. Increasing this calms the K line; setting it to 1 effectively disables smoothing.
K Type — which moving average algorithm smooths raw %K. Default is SMA. Exotic types like Jurik, Laguerre, or VAMA have their own parameter sets (see Power User settings) and behave differently from standard averages — use them only if you understand what they change.
D Length — length of the moving average applied to K to produce the D line. Default is 3, which is the standard stochastic D setting. Longer values make regime flips rarer and later.
D Type — same guidance as K Type, applied to the D calculation.
Blend Weight — this slot's relative influence in the weighted composite. Slots 1–3 default to 33.3; slots 4–10 default to 0. Weights auto-normalize across enabled slots. If you consider higher-timeframe momentum more important to your process, weight those slots higher. Leaving all weights equal when timeframes span a wide range gives short timeframes the same say as long ones — that may or may not match your intent.
Optional Ticker — overrides the symbol for this slot. Leave empty to use the chart symbol. Use this when you want to compare momentum on a correlated instrument. Be deliberate here — pulling from an unrelated or illiquid ticker and blending its stochastic as if it were comparable can produce misleading composite readings.
Line Width — visual preference for the slot's plot thickness.
Power User settings (per slot)
These apply only when specific MA types are selected for K or D smoothing. They are safe to ignore unless you are actively using the corresponding MA type.
- ALMA: Offset, Sigma, and Floor Offset parameters
- KAMA / FRAMA: Fast and Slow period parameters
- Jurik: Phase and Power parameters
- Laguerre: Alpha parameter
- VAMA: Volatility Length parameter
D-side Power User parameters mirror the K-side exactly, with their own separate values.
General settings
Overbought Level — upper reference line and alert threshold. Default is 70 on the -100 to +100 scale (roughly equivalent to 85 on a standard 0–100 stochastic).
Oversold Level — lower reference line and alert threshold. Default is -70 (roughly equivalent to 15 on a standard 0–100 stochastic).
Plot Blended K/D — toggles the composite blend lines on or off.
Blended Line Width — visual preference for the blend's plot thickness.
Master Smoothing settings
Enable Master Smoothing — applies a final moving average pass to blended K and D after all slot contributions are combined. Off by default. Enabling this adds another layer of lag to the composite.
Master MA Type — which moving average to use. Default is EMA.
Master Length — lookback for the master smoothing pass. Default is 3.
Master smoothing has its own Power User parameters (ALMA, KAMA, Jurik, Laguerre, VAMA) that apply only when the corresponding MA type is selected.
Alerts
All 39 alert conditions fire on confirmed (closed) bars only. This is true regardless of whether individual slots have "On Bar Close?" enabled or disabled.
Per-slot alerts (available for each of 10 slots)
| Alert | Fires when |
|---|---|
| Stoch XX Is Bullish | Slot K crosses above slot D on a confirmed bar |
| Stoch XX Is Bearish | Slot K crosses below slot D on a confirmed bar |
| Stoch XX Regime Flip | The K/D relationship reverses on a confirmed bar |
Blended alerts
| Alert | Fires when |
|---|---|
| Blended Stoch Is Bullish | Blended K is above blended D on a confirmed bar |
| Blended Stoch Is Bearish | Blended K is below blended D on a confirmed bar |
| Blended Stoch Regime Flip | The blended K/D relationship reverses |
| Blended Stoch Crossed Above Zero | Blended K crosses above the zero line |
| Blended Stoch Crossed Below Zero | Blended K crosses below the zero line |
| Blended Stoch Overbought | Blended K crosses above the overbought level |
| Blended Stoch Oversold | Blended K crosses below the oversold level |
Alignment alerts
| Alert | Fires when |
|---|---|
| All Stoch Slots Bullish | Every enabled slot has K > D on a confirmed bar |
| All Stoch Slots Bearish | Every enabled slot has K < D on a confirmed bar |
For the geeks
If you have used stochastic oscillators before, the first thing you will notice is that this one reads -100 to +100 instead of 0 to 100. That is not a bug.
A standard stochastic sits at 50 when price is in the middle of its lookback range. On its own, that is fine. But 50 as a midpoint carries no directional meaning — it is just the center of the scale. When you stack multiple stochastics from different timeframes and blend them, that ambiguity compounds. Is 50 leaning bullish? Bearish? Neutral? It depends on context every time you look at it.
This indicator shifts the scale so that zero is the midpoint. Positive values mean the stochastic is in the upper half of its range — what would be above 50 on a standard stochastic. Negative values mean it is in the lower half. Bullish and bearish momentum land on opposite sides of zero, which makes the blended reading easier to parse and regime shifts easier to spot.
Here is how the scales correspond:
- Standard 50 → this indicator's 0
- Standard 80 ≈ this indicator's 60
- Standard 20 ≈ this indicator's -60
- Standard 100 → this indicator's +100
- Standard 0 → this indicator's -100
You can verify this yourself: run a standard stochastic oscillator on the same timeframe with the same settings alongside this indicator. When the standard reads 50, this one should read 0. When the standard reads 80, this one should sit near 60.
The default overbought and oversold levels (70 and -70) reflect this shift. They correspond roughly to 85 and 15 on a standard stochastic.
FAQ
Why does this go from -100 to +100 instead of 0 to 100? The scale is shifted so zero sits at the neutral midpoint. This makes bullish-versus-bearish momentum easier to read at a glance and produces a cleaner composite when blending across timeframes. The "For the geeks" section above has the full explanation and reference mapping.
Does this indicator repaint? That depends on the "On Bar Close?" setting, which you control per slot. When enabled — the default for every slot — the slot uses only confirmed slot-timeframe data and does not repaint. When disabled, the slot updates intrabar for a faster read, but values will shift until that slot-timeframe bar closes. You can test this: turn "On Bar Close?" off on one slot, watch the line move during an open bar, then turn it back on and see the line settle to confirmed values.
Should I use all ten slots? Probably not. Three slots at well-separated timeframes (5m, 15m, 1h) is the default and a strong starting point. Adding closely spaced or highly correlated timeframes puts more weight on the blend without adding new information. Start with two to four slots that match your actual framework and expand when you have a specific reason.
What does the blended K/D tell me that individual slots don't? The blend gives you a single weighted summary of momentum across all enabled slots — useful as a quick agreement check. But it can also hide conflict. If one slot is strongly bearish while two others are mildly bullish, the blend might read neutral and mask the disagreement. Watch the individual slot lines alongside the blend, especially when weights are unequal or timeframes are closely spaced.
What if I get a runtime error about timeframes? The indicator requires every slot's timeframe to be equal to or higher than your chart timeframe. Setting a slot to a lower timeframe produces a runtime error. This is enforced on purpose — pulling lower-timeframe data from a higher-timeframe chart produces unreliable stochastic values. To fix it, raise the slot's timeframe or lower your chart timeframe.
Limitations
- Repainting depends on your settings. Slots with "On Bar Close?" disabled will repaint until the higher-timeframe bar closes. This is by design for traders who want intrabar updates, but you need to understand the tradeoff before turning off the default.
- The blend can smooth over real disagreement. A weighted composite naturally compresses individual slot differences. Unbalanced weights or closely spaced timeframes can make the blend look calmer than the underlying readings actually are.
- The settings surface is large. Ten slots with full smoothing parameters each means a lot of knobs. Most users will use two to four. Do not feel obligated to configure all of them.
- Slot timeframe must be >= chart timeframe. Setting a slot below the chart timeframe triggers a runtime error. The error message may not fully explain why — the short answer is that lower-timeframe security requests from a higher-timeframe chart cannot produce stable results.
- Exotic MA types require homework. Selecting Jurik, Laguerre, VAMA, or other non-standard smoothing without understanding their characteristics can produce oscillator behavior that is hard to read. SMA and EMA are reliable defaults.
- This is not a signal generator. Momentum agreement across timeframes is a context condition, not an entry or exit rule. Using blended K/D crossovers as standalone trade triggers — especially with many slots enabled — risks treating a summary statistic as a verdict.
Support and training
For questions, setup guidance, and training resources, visit the Axiom Charts website.
Disclaimer
This indicator is an analytical tool designed to support your own market analysis. It does not provide financial advice, trade recommendations, or guaranteed outcomes. Past behavior of any configuration does not predict future results. Trading carries substantial risk — only trade with capital you can afford to lose. Conduct your own analysis and consult a qualified financial professional before making trading decisions.
Related products
If this one is close but not quite right, there may be a better fit nearby for the same kind of chart work, testing need, or workflow gap.
Keep looking
If this one is close but not quite right, there may be a better fit nearby for the same kind of chart work, testing need, or workflow gap.
Find your starting pointWeighing a few options against each other?
Tell us what you are trying to accomplish and we will help you narrow it down honestly.