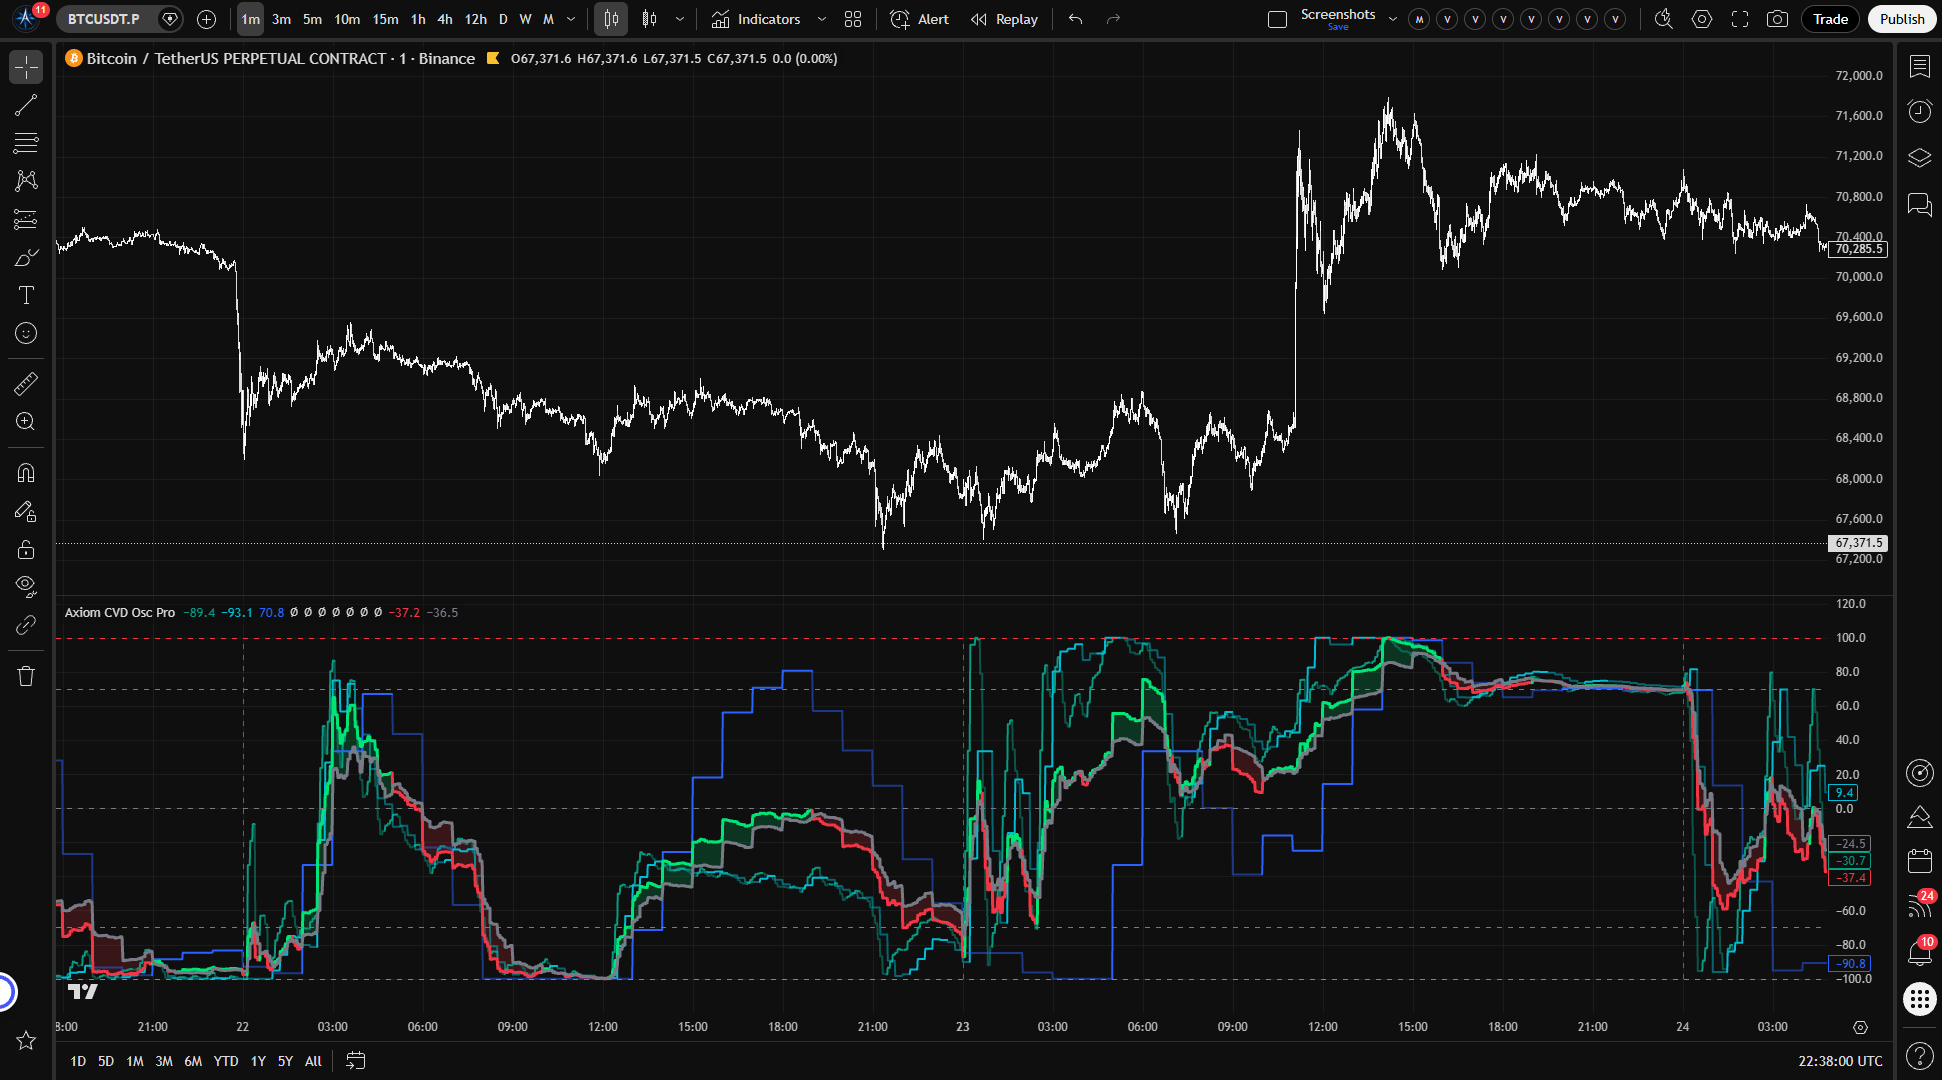
Axiom CVD Osc Pro
Overview
Judging whether the pressure behind a price move is real — and whether it holds across the timeframes and instruments you actually watch — usually means flipping between charts, stacking separate indicators, and mentally reconciling values that are not on the same scale. Most volume-delta tools make that harder than it should be: the estimation method is vague, the multi-timeframe lookup may be repainting without saying so, and the raw cumulative values drift until the chart is unreadable by mid-session.
This indicator was built to make those problems solvable in one pane. It runs up to ten independent CVD channels, each pulling lower-timeframe candle data to estimate directional volume participation. Every channel is normalized to a bounded -100 to +100 range. You can blend them into a single weighted composite or read them individually. Each channel is configured independently — timeframe, ticker, window mode, smoothing, blend weight, and repaint behavior are all per-channel decisions.
The estimation boundary needs to land here, before anything else: this is not order-flow data. The delta is estimated from OHLCV candle structure using an Axiom-built wick-aware participation model. That model recovers more directional information than a simple close-vs-open approach — it factors in body direction, close position, and wick rejection, and classifies each intrabar into graduated participation buckets rather than treating every candle as the same strength. But it is still working from price and volume, not from the bid/ask tape. The word "CVD" carries order-flow connotations. This tool earns its value on different terms.
Repainting is not a hidden property — it is a per-slot switch you control. Each channel has its own "On Bar Close?" toggle. With it enabled (the default), that channel uses the last confirmed higher-timeframe value and the historical output is stable. With it disabled, the channel tracks the building HTF bar in real time and values shift until that bar closes. Both modes are labeled, both are useful in different workflows, and you can verify the difference on a live chart within a few bars.
Good fit: You already use volume-pressure analysis as one layer in a structured process. You work across at least two timeframes or track correlated instruments. You are comfortable configuring per-channel settings and verifying what the readings mean before you act on them. You understand that candle-derived CVD is an estimate with real limits.
Not a fit: You want a signal that tells you when to enter and exit. You expect this to replace tick-level order flow or footprint charts. You are looking for something that works on defaults without setup effort or context from your broader method.
Why this matters
A trader who manually compares volume-pressure readings across three or four timeframes is spending real hours on a task that a well-built tool should handle. And a trader who trusts a CVD reading without knowing whether it came from tape data or a candle heuristic is making decisions on ground they have not tested. Both problems compound under the time pressure of a live session — the first one eats your preparation window, and the second one can eat your account.
This indicator does not fix either of those problems by default. It addresses the first by consolidating up to ten channels on one bounded scale, and the second by making the estimation method, normalization window, and repaint behavior visible and adjustable per channel. A consolidated view is only useful when you understand what each line measures and how far to trust it. The per-channel controls exist so you can reach that understanding on your own instruments, through your own testing.
Features
Ten independent CVD channels — Each enabled channel draws its own normalized CVD line, colored by regime: one shade when CVD sits above its signal line, another when it falls below. You see each timeframe's pressure reading individually, in one pane, without the scale problems that come from plotting raw cumulative values.
Per-channel ticker override — Any channel can pull data from a different instrument. Watch BTC volume pressure while charting ETH. Compare ES and NQ side by side. Each override uses TradingView's dynamic security requests. The blend averages each slot's already-normalized output, so cross-ticker slots are range-comparable inside the pane, not raw-volume comparable across markets.
Per-channel timeframe and window control — Each channel runs on its own timeframe with its own accumulation window. Session mode anchors to a periodic reset boundary (daily, weekly, or custom). Rolling mode uses a continuously sliding lookback with no resets. You choose per channel, so a daily-session 15-minute channel can sit next to a rolling 4-hour channel in the same indicator.
Blended CVD and Signal lines — A weight-normalized composite across enabled channels that currently have a positive blend weight and valid readings. One reading for the full stack when you need a single summary instead of ten. Blend weights auto-normalize: disabling a channel or setting its weight to zero shifts the share to the remaining contributing channels. A channel with weight zero still plots and fires alerts, it just stops influencing the blend. If no enabled channel is contributing a positive-weight valid reading, the blended lines stay unavailable until one does.
CVD/Signal fill — Shaded area between the blended CVD and Signal lines that shifts color with regime direction. Expanding fill means the leading side is gaining ground. Narrowing fill means the current regime is losing conviction. The fill gives a quick visual read without needing to compare numeric values.
Session reset markers — Vertical dashed lines at window boundaries for any channel running in Session mode. They mark exactly where the accumulation window restarted. Readings before and after a reset line are not continuous — accumulation and normalization both restarted at that boundary.
Axiom MA Library integration — All smoothing — CVD, Signal, and the optional Master pass — runs through the Axiom MA Library Pro. That means SMA, EMA, KAMA, FRAMA, Jurik, Laguerre, ALMA, VAMA, and others are available per channel. Each exotic MA type activates its own Power User parameters (ALMA offset/sigma, Jurik phase/power, Laguerre alpha, KAMA fast/slow). You are not locked to SMA and EMA.
Optional Master Smoothing — A final MA pass applied after the blend. Useful when the composite is noisier than your process needs. Off by default because master smoothing on top of already-smoothed channels compounds lag — worth using deliberately, not by accident.
Reference lines — Horizontal markers at -100, the oversold level, zero, the overbought level, and +100. A fixed grid for the bounded range. The overbought and oversold thresholds are user-configurable.
How to use
- Add the indicator to your chart. A 5-minute chart works well for initial setup because the default channels request higher-timeframe data that needs room below.
- Out of the box, three channels are enabled: 5m, 15m, and 60m, with lower-TF precision at 1m, 1m, and 5m respectively. Window mode is Session anchored to Daily. Smoothing is SMA(3) for both CVD and Signal. Blend weights are equal across all three.
- Check that the output stays within -100 to +100, that you see three colored channel lines plus the green/red blended lines, and that dashed vertical markers appear near the daily open for the session-anchored channels.
- Toggle "On Bar Close?" off for any channel and watch the most recent bars update live as the current HTF bar builds. Toggle it back on and confirm values freeze at the last completed bar.
- Set one channel's blend weight to zero. The blended line should stop reflecting that channel's data while the channel's individual plot and alerts remain active.
What correct first use looks like: Multiple colored oscillator lines staying bounded. A blended CVD line crossing above and below its Signal line. Fill that shifts color with regime changes. Vertical markers at session boundaries. No runaway drift. The readings should feel like pressure context, not like a signal screaming at you.
What a wrong setup looks like: A channel whose timeframe is below the chart timeframe will throw a runtime error. A Lower TF Precision set at or above the channel's timeframe will also error. These constraints are enforced — the indicator will tell you.
Settings
Per-channel core settings (repeated for each of 10 channels)
Enable (default: on for channels 1-3, off for 4-10) — Whether the channel runs, plots, blends, and fires alerts. Disabled channels consume no resources and produce no output. Enable additional channels when they represent genuinely different timeframes or instruments — not to duplicate nearby readings for the appearance of broader agreement.
Hide Plot (default: off) — Hides the channel's individual line from the chart but keeps it active in the blend and in alert calculations. Useful for keeping the blend weighted by a timeframe you do not need to watch visually. Remember that a hidden channel still influences the blended output.
Timeframe (defaults: 5 / 15 / 60 / empty for 4-10) — The timeframe whose data this channel processes. Must be at or above the chart timeframe. Empty uses the chart timeframe. Choose timeframes that represent genuinely different analytical horizons for your process.
Lower TF Precision (defaults: 1 / 1 / 5 / 1 for 4-10) — The lower timeframe supplying intrabar OHLCV arrays for the participation model's delta estimation. Lower values give finer-grained scoring but depend on data availability for that instrument. Must be strictly below the channel's timeframe.
Window Mode (default: Session) — Session resets CVD accumulation at each window boundary. Rolling uses a continuously sliding lookback with no resets. Session suits instruments with meaningful opens — equities, futures with defined sessions. Rolling suits 24/7 markets where a midnight reset is arbitrary.
Window (default: D) — In Session mode, the reset period. In Rolling mode, the lookback duration. Must be at or above the channel's timeframe.
CVD Length (default: 3) — Smoothing applied to normalized CVD. Higher values calm the reading. Lower values keep it reactive. With simple MA types, length 1 gets you very close to the unsmoothed normalized series. Adaptive and approximation-based MA types still run through their own formulas even at length 1.
CVD Type (default: SMA) — The moving average algorithm for CVD smoothing. Includes SMA, EMA, KAMA, FRAMA, Jurik, Laguerre, ALMA, VAMA, and others via the Axiom MA Library Pro. Selecting an exotic type activates its Power User parameters for that channel.
Signal Length (default: 3) — Smoothing for the Signal line derived from CVD. Longer values slow regime transitions. Shorter values make regime flips faster and more frequent.
Signal Type (default: SMA) — Moving average algorithm for Signal smoothing. Same library, same Power User parameter activation.
Blend Weight (default: 33.3 for channels 1-3, 0.0 for 4-10) — The channel's relative contribution to the blended composite. Weights auto-normalize across contributing channels — a single channel at weight 100 and three channels at 33.3 produce the same proportional influence. A weight of zero keeps the channel's plot and alerts active while removing it from the blend entirely. If every enabled channel is weight zero, or no positive-weight channel currently has a valid reading, the blended CVD/Signal have nothing to calculate.
Pressure Sensitivity (default: 1.50 · range: 0.25–4.0) — Controls how aggressively the participation model classifies each intrabar into strength buckets. Higher values push bars toward strong classifications faster, which sharpens the oscillator on trending instruments. Lower values keep more bars in the graduated middle range, which can be more informative in choppy conditions. At the extreme high, the graduated bucket system that gives this model its edge collapses toward a binary read. Test across the range on your instruments before settling.
Wick Weight (default: 0.20 · range: 0.0–0.50) — Controls how much wick rejection influences the participation classification. Increase it on instruments where rejection candles carry real information about absorption or exhaustion — lower timeframes on futures, for instance. Decrease it where wick noise is common — wide-spread crypto pairs, thin pre-market data. At zero, wick information is removed entirely. At the maximum, wick imbalance can override what body direction and close position are saying.
Optional Ticker (default: chart symbol) — Overrides the data source for this channel. Use it for cross-market context — BTC vs. ETH, ES vs. NQ. The channel processes the override ticker's OHLCV data at whatever timeframe and lower-TF precision you configured. Tickers with drastically different volume profiles will produce readings on a very different underlying scale, even after normalization — interpret cross-ticker blends with that in mind.
Line Width (default: 2) — Visual thickness of the channel's plot. Cosmetic only.
Per-channel Power User settings
On Bar Close? (default: on) — The repaint switch for this specific channel. When enabled, the channel uses the last confirmed higher-timeframe bar value ([1] offset) and historical output does not change. When disabled, the channel updates with the still-building HTF bar — faster reads, but values shift until that bar completes. This is repainting by design, not a defect. Each channel has its own toggle, so you can run some channels confirmed and others live in the same indicator.
ALMA Offset / ALMA Sigma / ALMA Floor Offset? — ALMA-specific tuning parameters for this channel's CVD smoothing. Only active when CVD Type is ALMA. Defaults: 0.85 / 6.0 / off.
KAMA/FRAMA Fast / Slow — Adaptive speed parameters for KAMA and FRAMA smoothing. Only active when CVD Type is KAMA or FRAMA. Defaults: 2 / 30.
Jurik Phase / Jurik Power — Jurik MA tuning for this channel's CVD smoothing. Only active when CVD Type is Jurik. Defaults: 0 / 2.0.
Laguerre Alpha — Laguerre filter damping. Only active when CVD Type is Laguerre. Default: 0.5.
VAMA Vol Length — Volatility lookback for VAMA smoothing. Only active when CVD Type is VAMA. Default: 20.
Each channel also has a matching set of Power User parameters for its Signal line smoothing. They mirror the CVD parameters and activate when the Signal Type uses the corresponding MA.
Global settings
Overbought / Oversold Levels (defaults: 70.0 / -70.0) — Reference lines and alert thresholds for the bounded range. These mark where the blended reading is stretched relative to recent history — not where reversals happen. Tighten for stricter extreme detection. Widen for a broader working range.
Plot Blended CVD/Signal (default: on) — Whether the composite blended lines and fill are drawn. Disable when you only want the individual channel readings.
Blended Line Width (default: 3) — Visual thickness of the blended CVD and Signal lines. Cosmetic only.
Enable Master Smoothing (default: off) — Applies one more MA pass to the already-blended CVD and Signal. Off by default because additional smoothing on an already-smoothed composite adds lag. Turn it on when the blended output is noisier than your process needs, and understand that you are trading responsiveness for calm.
Master MA Type (default: EMA) — Algorithm for the master smoothing pass.
Master Length (default: 3) — Lookback length for master smoothing.
Master-level ALMA, KAMA/FRAMA, Jurik, Laguerre, and VAMA parameters follow the same pattern as the per-channel Power User settings and activate when Master MA Type uses the corresponding algorithm.
Alerts
All 29 alert conditions fire only on confirmed bars. Nothing triggers mid-bar.
Per-channel regime alerts (20 conditions)
Each of the 10 channels has two alerts:
| Alert | Fires when |
|---|
| CVD [N] Is Bullish | Channel N enabled, CVD > Signal, bar confirmed |
| CVD [N] Is Bearish | Channel N enabled, CVD < Signal, bar confirmed |
Blended alerts (7 conditions)
| Alert | Fires when |
|---|
| Blended CVD Is Bullish | Blended CVD > blended Signal, bar confirmed |
| Blended CVD Is Bearish | Blended CVD < blended Signal, bar confirmed |
| Blended CVD Regime Flip | Blended regime changed on this bar (edge-triggered) |
| Blended CVD Crossed Above Zero | Blended CVD crossed above the zero line |
| Blended CVD Crossed Below Zero | Blended CVD crossed below the zero line |
| Blended CVD Overbought | Blended CVD crossed above the overbought level |
| Blended CVD Oversold | Blended CVD crossed below the oversold level |
Alignment alerts (2 conditions)
| Alert | Fires when |
|---|
| All CVD Slots Bullish | Every enabled channel that currently has a valid CVD reading has CVD > Signal simultaneously |
| All CVD Slots Bearish | Every enabled channel that currently has a valid CVD reading has CVD < Signal simultaneously |
Behavior note: The per-channel and alignment regime alerts are state alerts — they fire on every confirmed bar where the condition holds, not only on transitions. The Blended CVD Regime Flip is the only edge-triggered regime alert — it fires once, on the bar where the state actually changes. The zero-line and OB/OS alerts are crossover-triggered. For most workflows, set the TradingView alert frequency to "Once Per Bar Close."
For the geeks
Most candle-based CVD tools estimate delta with one rule: if the close is above the open, the bar's volume counts as buying pressure; below, selling. That works as a rough filter. But it treats a bar closing one tick above its open the same as a bar closing at its high, and it throws away what the wicks are actually showing about rejection and failed attempts.
This indicator scores each lower-timeframe intrabar on three dimensions: which direction the body moved, where the close landed within the full bar range, and whether the wicks suggest rejection pressure in one direction. Those three inputs combine into a directional intent score that gets classified into one of five participation buckets: strong bullish, weak bullish, neutral carry, weak bearish, strong bearish. Each intrabar's volume is then multiplied by its bucket value to produce signed delta for that bar.
The bucketing is the key design choice. A continuous score would look more precise, but ambiguous bars near the midpoint would inject noise into the cumulative total with every tick of variation. Discrete buckets absorb that ambiguity — a bar near the boundary stays in one bucket rather than oscillating between fractional values. The cost is that a bar sitting right at the edge of two buckets can flip classification on a small change. Pressure Sensitivity and Wick Weight exist specifically to let you position those boundaries where they work best for the instruments you trade.
Pressure Sensitivity moves the bucket thresholds. Low values keep the model cautious — more bars land in the weak or carry range, and the oscillator moves gently. High values make the model more decisive — bars commit to strong classifications faster and the oscillator responds more sharply. At the extreme, the graduated system that gives this model its value collapses into a near-binary read. The graduated middle ground is where the nuance lives.
Wick Weight controls how much wick rejection contributes to the directional intent score. At low values, body direction and close position do most of the work. At higher values, a pronounced rejection wick can shift a bar's classification meaningfully — useful on instruments where wicks carry genuine information about absorption or exhaustion, less useful where wide spreads make wicks noisy by default.
Neutral or ambiguous bars — where the intent score falls near zero — inherit a reduced version of the prior bar's directional state. This carry behavior prevents the delta from swinging on bars that genuinely lack directional information, while still fading the inherited direction over consecutive neutral bars rather than holding it indefinitely.
The normalization that keeps the output bounded works piecewise within each channel's active window. Positive CVD is scaled against the window's running positive extreme. Negative CVD is scaled against the absolute running negative extreme. Zero is always included in both ranges, so the midline retains its meaning. The output stays between -100 and +100 regardless of how far raw cumulative delta drifts underneath. Early in a session window, the range is still narrow and the oscillator can reach extremes quickly. As the window fills and the range widens, the readings moderate. A value of +70 means the current positive CVD is 70% of the highest positive CVD this window has seen — nothing more.
You can verify all of this. Set Pressure Sensitivity to the minimum (0.25) and the oscillator should flatten noticeably — most bars landing in weak or carry buckets. Push it to the maximum (4.0) and the oscillator should sharpen, with fewer bars in the middle range. Adjust Wick Weight from 0.0 to 0.50 on candles with prominent rejection wicks and watch the classification shift. Compare a Session-mode channel across a daily reset to see normalization restart. The mechanics are on the chart whenever you want to test them.
FAQ
Is this the same as real order-flow data?
No. This indicator estimates directional volume participation from OHLCV candle structure — not from bid/ask tape, footprint data, or exchange-level order feeds. The wick-aware participation model recovers more directional information than a simple close-vs-open heuristic, but the output is an inference from what candles show, not a measurement from the order book. If your process depends on tape-level precision, this is not a substitute.
Does this indicator repaint?
That depends on how you configure each channel. The "On Bar Close?" toggle in each channel's Power User section controls it independently. With it enabled (the default), that channel uses confirmed higher-timeframe values and historical output is stable. With it disabled, the channel tracks the building HTF bar — faster reads, but values shift until that bar closes. You can run confirmed and live channels side by side, and the difference is visible within a few bars on a live chart.
Should I use all ten channels?
Probably not, and especially not at first. Start with two or three channels covering genuinely different timeframes — something like your execution timeframe, your trend timeframe, and one step above. Add channels when you have a reason: a correlated instrument, a longer structural horizon, a specific session window you want to isolate. Ten similar-timeframe channels with similar settings will agree mathematically because they are measuring nearly the same data. That agreement is redundancy, not confirmation.
What does Pressure Sensitivity actually change?
It moves the thresholds between the participation model's five classification buckets. At low values, more intrabars land in the weak or carry range and the oscillator moves gently. At high values, bars commit to strong classifications faster and the oscillator reacts more sharply. The default of 1.50 is a moderate starting point. Test across the range on your instruments — what reads well on ES may not suit a small-cap crypto pair.
Does this work on crypto, forex, or low-volume instruments?
It works on any instrument that reports OHLCV data with volume. But the quality of the estimate varies. On liquid futures and large-cap equities, the intrabar data is dense and the participation model has plenty to work with. On thin-volume instruments, wide-spread pairs, or symbols with sparse lower-timeframe history, the estimation degrades — fewer intrabars means coarser scoring, and the script may fall back to single-bar resolution. Test on your specific instruments and timeframes. If the output looks erratic or flatlined, the data may not support the resolution you configured.
Limitations
OHLCV estimation, not order flow. The delta values are inferred from candle structure. This indicator does not access bid/ask tape, time and sales, or depth-of-book data. On instruments with thin volume or limited lower-timeframe history, the inference becomes coarser. The oscillator still produces a bounded number in those conditions — it does not flag that the estimate has degraded. Verifying data quality on your specific instrument and timeframe pairing is your responsibility.
Lower-TF fallback. When the lower-timeframe request returns empty intrabar arrays — sparse history, unsupported timeframe pairs, or limited exchange coverage — the indicator falls back to a single-bar participation estimate using the channel bar's own OHLCV. The same model runs, but at single-bar resolution it loses the granularity that intrabar scoring provides.
Window-dependent normalization. A reading of +70 in one session is not directly comparable to +70 in a different session. Each value represents the proportion of pressure relative to that window's running extremes, not a fixed volume quantity. Early in a window, the range is narrow and extremes come easily. Comparing across windows or across channels with different window configurations requires awareness that each denominator shifts independently.
Session anchors on 24/7 markets. Session mode resets CVD accumulation at the window boundary — a Daily anchor defaults to the exchange session open or UTC midnight depending on the instrument. On markets that trade continuously without a meaningful open, that reset is arbitrary. Rolling mode exists for this situation.
Redundant channel agreement. Ten channels configured with overlapping timeframes and similar settings will produce blended agreement that looks like strong confirmation but is actually mathematical overlap. The blend measures genuine multi-timeframe convergence only when the channels cover meaningfully different horizons or instruments.
Not a signal generator. This indicator reads directional volume pressure. It does not produce entries, exits, stop levels, or position sizing. Overbought and oversold levels mark where the reading is stretched relative to recent history — not where price will reverse. Alignment alerts surface a condition. What you do with that condition is part of your process, not part of this tool.
Support and training
Visit the AxiomCharts website for documentation, training materials, and support.
Disclaimer
This indicator is provided for educational and informational purposes only. It does not constitute financial advice, and no trading outcomes are implied or guaranteed. Past behavior observed in any backtest, demo, or historical view does not predict future results. Trading involves substantial risk of loss and is not suitable for every investor. You are solely responsible for your own trading decisions.